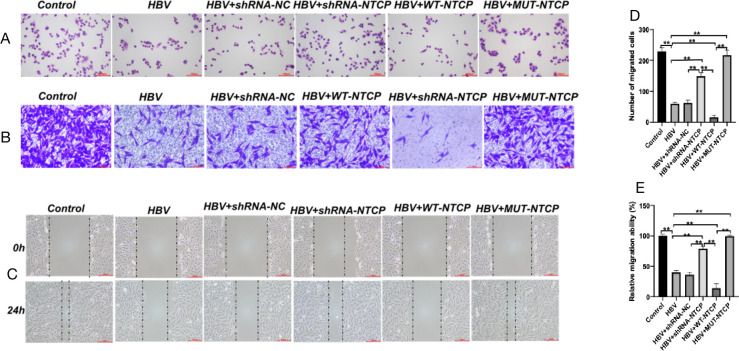
Fig 7.
Podocyte proliferation and migration after HBV infection. Differentiated podocytes were treated as above. Cell morphology was evaluated by Wright-Giemsa staining (A). Scale bar = 100 µm. Cells that migrated through the Matrigel-free chambers (B, D) were stained with crystal violet. Sale bar = 100 µm. Lateral migration was measured by wound healing assay. Representative wound images were captured (C) at 0 and 24 h after scratching, and the healed rate was calculated (E). Scale bar = 200 µm. Results are mean ± SD for three individual experiments. *P < 0.05, **P < 0.01.

