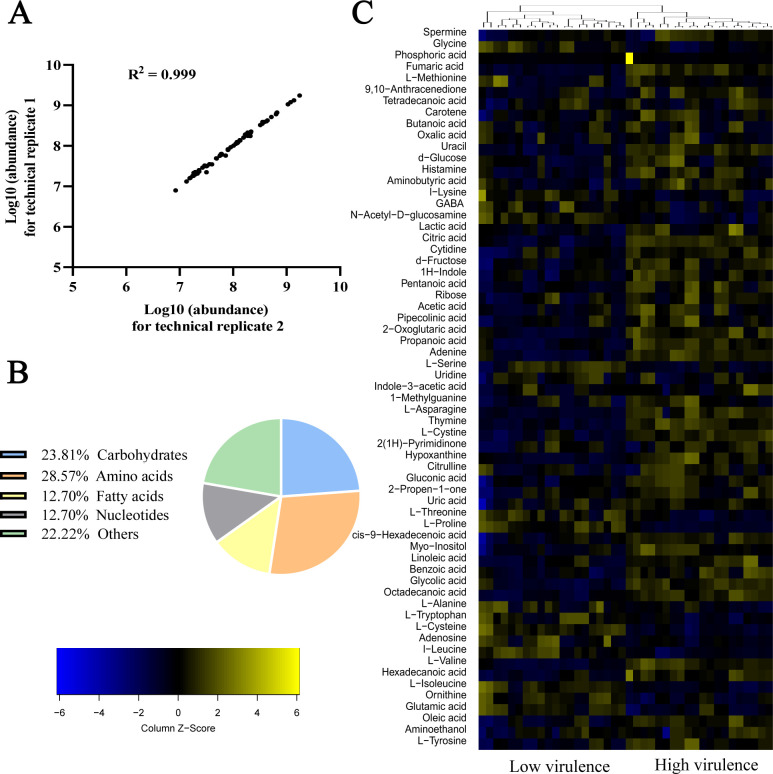
Fig 2.
Metabolic profile of high- and low-virulent A. baumannii strains. (A) Pearson correlation coefficient of technical replicates. (B) Categories of all identified metabolites. (C) Heatmap of unsupervised hierarchical clustering of all metabolites. Yellow and blue colors indicate increased and decreased levels of the metabolites, respectively.

