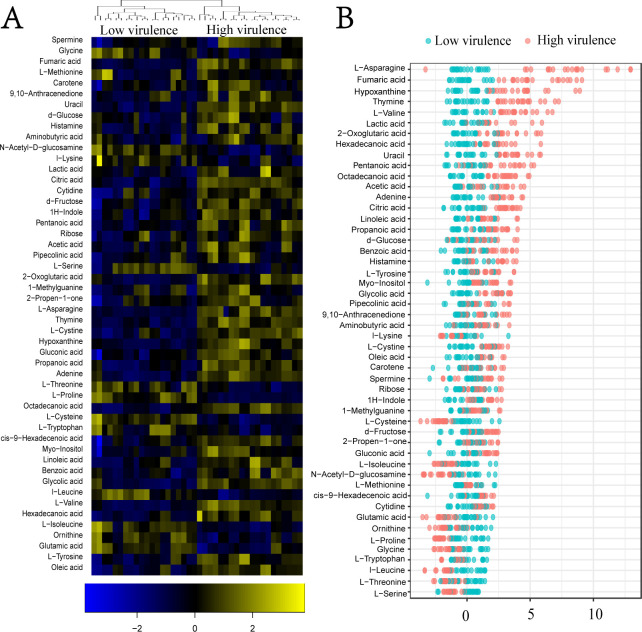
Fig 3.
Differential metabolomic analysis of high- and low-virulent A. baumannii strains. (A) Heatmap illustrating the differential metabolites. Blue and yellow colors indicate decreased and increased metabolite levels, respectively. (B) Z-score plot displaying the changing levels of differential metabolites. Each dot represents a metabolite in one technical replicate.

