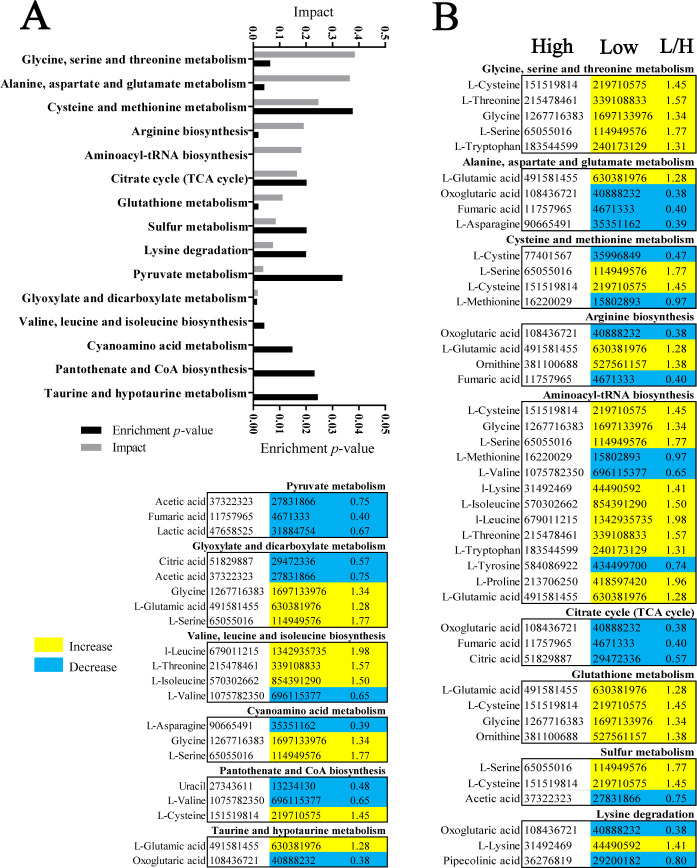
Fig 4.
Enriched pathways in high- and low-virulent A. baumannii strains. (A) Pathway enrichment analysis of differential metabolites between high- and low-virulent A. baumannii strains (P < 0.05). (B) Integrative analysis of differential metabolites in significant pathways (P < 0.05). The terms “low” and “high” refer to low-virulent and high-virulent strains, respectively. Increased and decreased metabolites are represented by yellow and blue colors, respectively.

