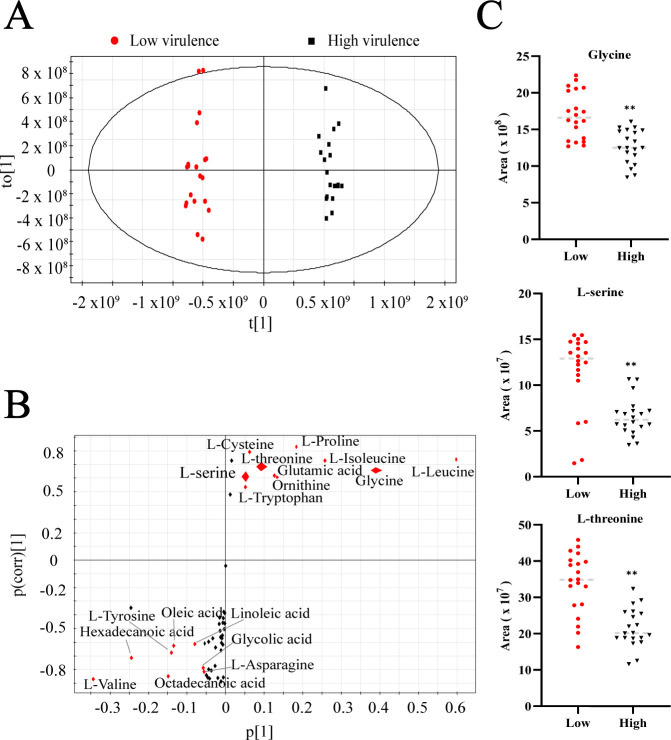
Fig 5.
Biomarkers for the virulence of A. baumannii strains. (A) OPLS-DA of metabolomes in high-virulent and low-virulent A. baumannii strains. The black and red dots represent the biological and technical replicate analysis of high- and low-virulent strains, respectively. (B) S-plot generated by OPLS-DA. The predictive indicator P[1] and correlation P(corr)[1] were used to distinguish low-virulent strains. Metabolites with absolute P and absolute P(corr) values greater than or equal to 0.05 and 0.5, respectively, were considered potential biomarkers and are marked in red. (C) Scatter plot of metabolites in the glycine, serine, and threonine metabolism pathways. **P < 0.01.

