Fig 2.

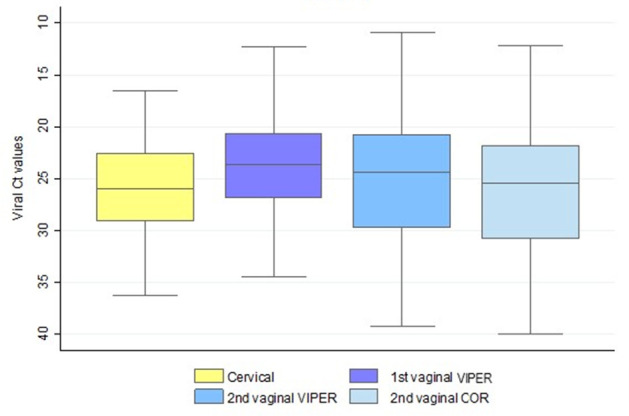
hrHPV cycle threshold (Ct) values for all sample types. In case of multiple infections, the lowest Ct value was considered. Boxplots indicate median Ct values, interquartile ranges, and extreme values (whiskers).

hrHPV cycle threshold (Ct) values for all sample types. In case of multiple infections, the lowest Ct value was considered. Boxplots indicate median Ct values, interquartile ranges, and extreme values (whiskers).