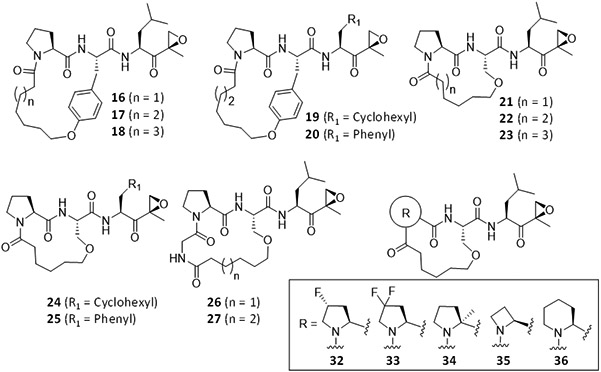
TABLE 1.
In vitro proteasome inhibition profiles by macrocyclic peptide epoxyketones. a

| ||||
|---|---|---|---|---|
| IC50 (nM) | ||||
| LMP2 | Y | LMP7 | X | |
| YU102 | 105.2 ± 6.2 | 206.7 ± 5.5 | >10,000 | >10,000 |
| KZR-504 | 157.9 ± 8.5 | 4,763 ± 54 | >10,000 | >10,000 |
| DB-310 | 70.8 ± 1.7 | 589.9 ± 4.7 | >10,000 | >10,000 |
| 16 | 422.8 ± 68.0 | ND | >10,000 | >10,000 |
| 17 | 129.3 ± 21.8 | 715.1 ± 88.0 | 1,516 ± 337 | 4,766 ± 549 |
| 18 | 414.5 ± 30.1 | 414.5 ± 62.7 | 341.8 ± 50.9 | 4,998 ± 704 |
| 19 | 167.7 ± 39.4 | ND | 2,686 ± 489 | 4,998 ± 704 |
| 20 | 184.1 ± 19.0 | 8,385 ± 847 | 399.3 ± 27.6 | 4,640 ± 781 |
| 21 | 412.8 ± 151.1 | 1,503 ± 398 | >10,000 | 1,081 ± 223 |
| 22 | 563.4 ± 87.0 | ND | >10,000 | 4,640 ± 781 |
| 23 | 158.1 ± 30.4 | ND | >10,000 | >10,000 |
| 24 | 522.6 ± 67.5 | ND | 5,773 ± 1007 | >10,000 |
| 25 | 251.1 ± 35.8 | ND | >10,000 | >10,000 |
| 26 | 69.4 ± 12.8 | ND | >10,000 | >10,000 |
| 27 | 65.6 ± 14.5 | ND | >10,000 | >10,000 |
| 32 | 2,131 ± 383 | >10,000 | >10,000 | >10,000 |
| 33 | 237.7 ± 24.4 | ND | >10,000 | >10,000 |
| 34 | 4,583 ± 601 | ND | >10,000 | >10,000 |
| 35 | 261.5 ± 53.2 | ND | >10,000 | >10,000 |
| 36 | 1,245 ± 200 | ND | >10,000 | >10,000 |
The activity of individual proteasome subunits was measured using purified human 20S proteasomes and the respective fluorogenic substrates, Ac-PAL-AMC (for LMP2), Ac-nLPnLD-AMC (for Y), Ac-ANW-AMC (for LMP7), and Ac-WLA-AMC (for X). Data were obtained based on the results of 3 replicates per compound. N.D. denotes “not determined.”
