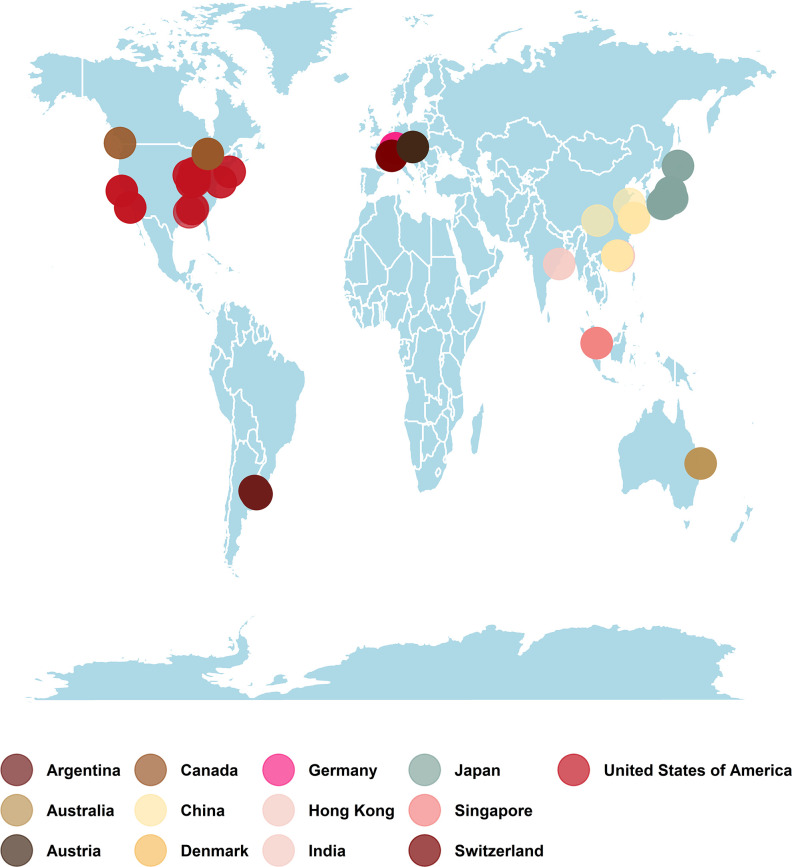
Fig 1.
Map showing the geographical distribution of samples collected from different locations. A total of 165 samples were collected, covering 13 different locations and 5 continents. The map was generated with Tidyverse package in R using geographical coordinates (longitude and latitude) of sample metadata retrieved from SRA.

