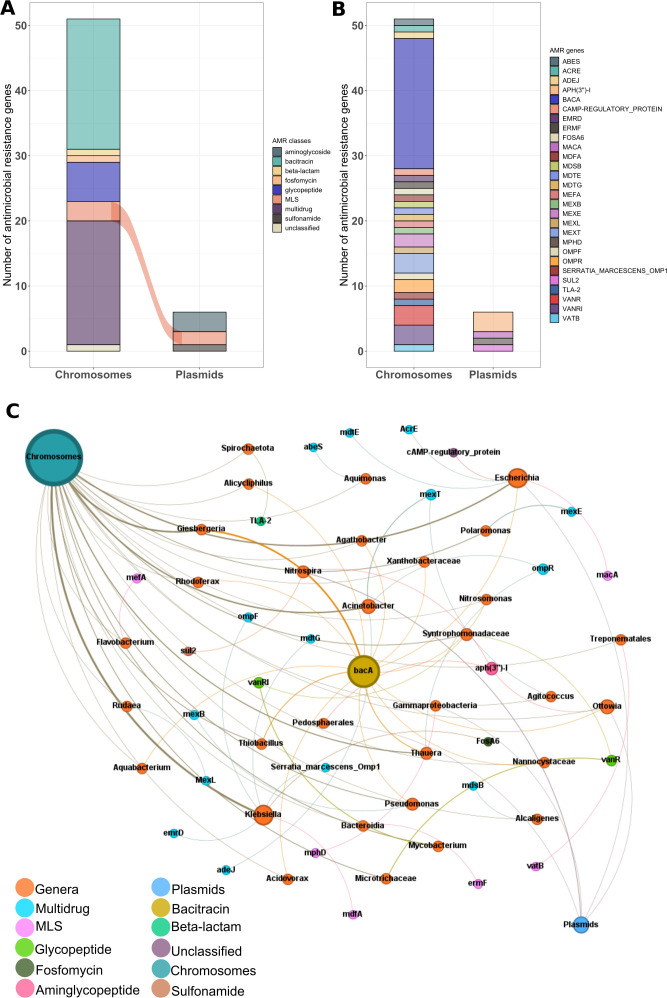
Fig 6.
The abundance of antibiotic resistance genes and co-occurrence network. (A) Bar plot showing the ARG classes’ frequency encoded by plasmids and chromosomes. (B) Bar plot showing the frequency of ARGs located inside plasmids and chromosomes. (C) Network showing the host range (genus) and co-occurrence between ARGs found in chromosomes and mobile genetic elements such as plasmids.

