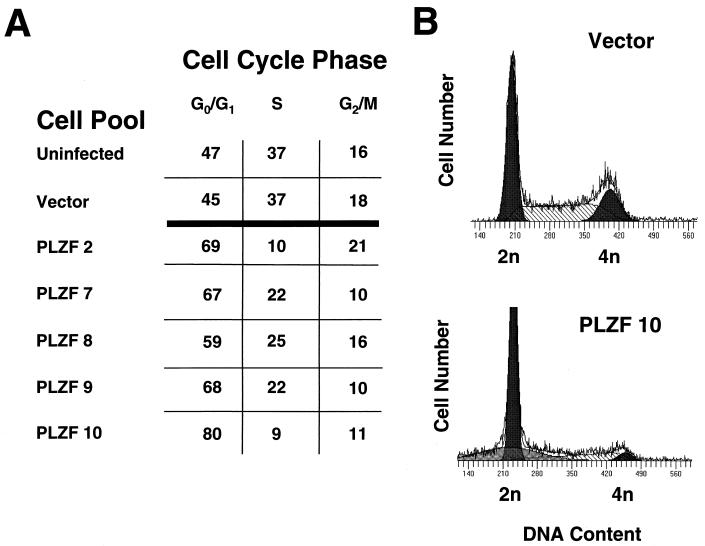
FIG. 3.
Effect of PLZF expression on cell cycle profile of 32DG/GM cells. (A) The cell cycle distributions of control and PLZF-expressing pools of 32DG/GM cells. Cells were plated at an initial density of 5 × 10⁴/ml, grown for 2 days, and analyzed by PI staining and FACS analysis. Hypodiploid cells were excluded from this analysis. (B) Representative DNA content histograms of PLZF pool 10 and a vector-infected control pool. Curves modeling the G0/G1, S, and G2 compartments are shown.

