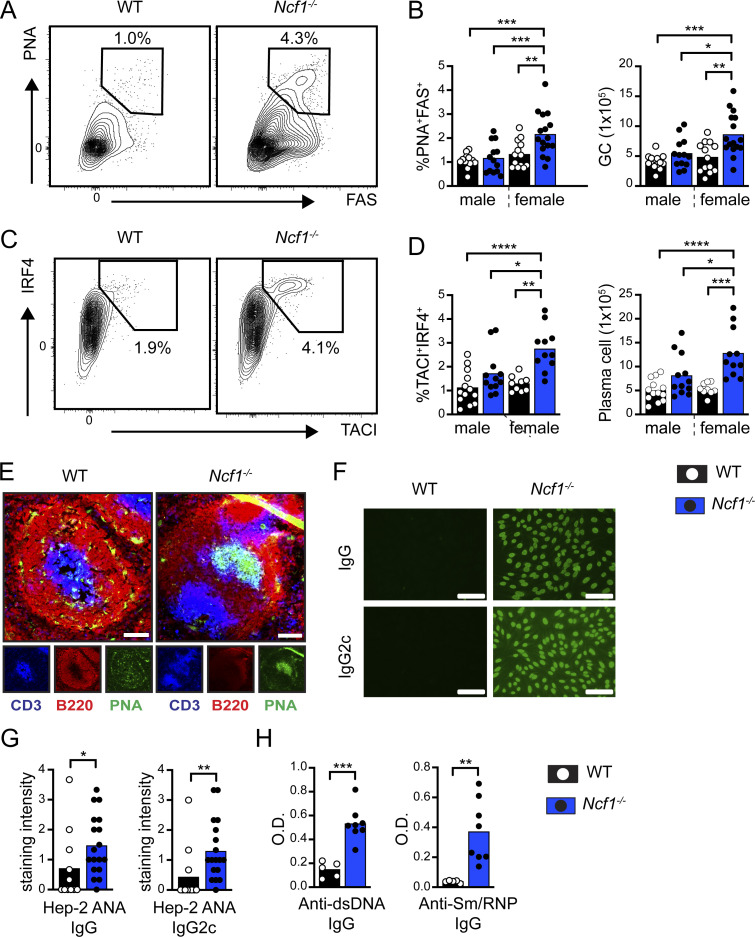
Figure 2.
Spontaneous humoral autoimmunity in aged Ncf1-deficient mice. (A) Representative FACs plots (gated on CD19+ B cells) showing spontaneous splenic GCs in 1-year-old WT and Ncf1−/− mice. Number: percentage of PNA+FAS+ GC B cells. (B) Percentage and total number of splenic GC B cells in 1-year-old WT and Ncf1−/− mice. (C) Representative FACS plots (gated on B220−CD19− splenocytes) showing the expansion of TACI+IRF4+ plasma cells in Ncf1−/− animals. (D) Percentage and total number of splenic TACI+IRF4+ plasma cells in 1-year-old WT and Ncf1−/− mice. (E) Representative splenic sections stained with B220 (red), PNA (green), and CD3 (blue) showing spontaneous GC formation in Ncf1−/− mice. Scale bars, 100 µm. (F) Hep-2 ANA IgG and IgG2c staining in representative female WT and Ncf1−/− mice. Scale bars, 100 µm. (G) Quantification of Hep-2 ANA IgG and IgG2c staining intensity in female WT and Ncf1−/− mice. ANA staining intensity (range 0–4) was scored by three independent observers blinded to genotype and subsequently averaged. (H) Anti-dsDNA and anti-Sm/RNP IgG titers in 1-year-old female WT and Ncf1−/− mice. (A–H) Data combined from of two (D, n = 9–13/group; H, n = 5–8/group), or three (B, n = 13–16/group; G, n = 11–18/group) independent experimental cohorts. Each point represents an individual experimental animal. *, P < 0.05; **, P < 0.01; ***, P < 0.001; and ****, P < 0.0001 by one-way ANOVA, followed by Tukey’s multiple comparison test (B and D) or by two-tailed Student’s t test (G and H).

