Figure 5.
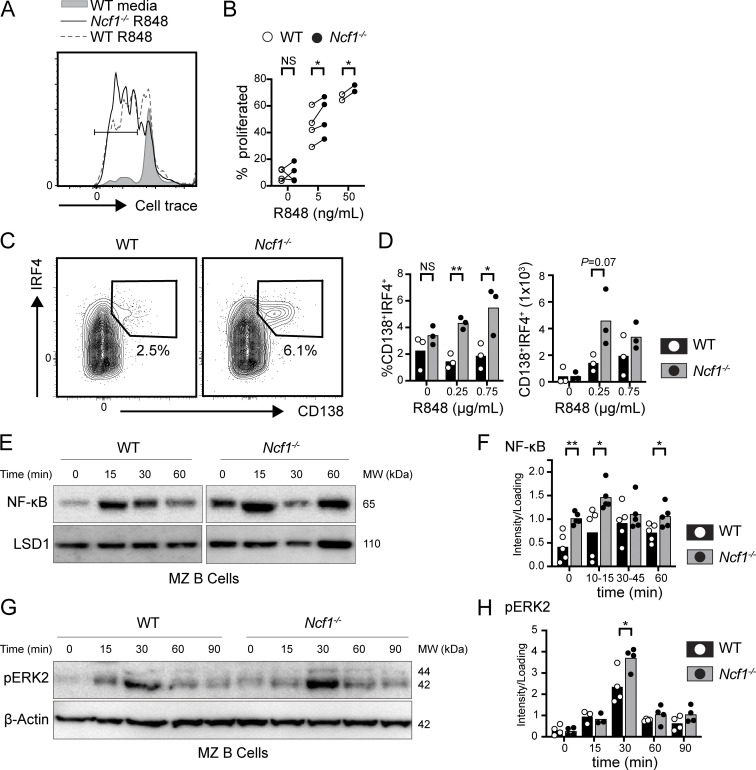
Increased endosomal TLR signaling in NCF1-deficient mouse B cells. (A and B) Sorted MZ B cells from female WT and Ncf1−/− mice were stimulated with TLR7 agonist, R848. (A) Histogram depicting CellTrace Violet dilution in WT (R848 0 ng/ml; gray filled), WT (R848 5 ng/ml; gray line), and Ncf1−/− (R848 5 ng/ml; black line) MZ B cells. Gate: percentage proliferated. (B) Proliferation of sorted WT versus Ncf1−/− MZ B cells 48 h after stimulation with indicated R848 dose. Each paired data point represents an independent experiment. (C and D) Splenic B cells cultured for 4 days on CD40L/BAFF-expressing feeder cells plus 10 ng/ml IL-21, and the indicated dose of R848. (C) Representatives FACS plots (gated on live cells) showing in vitro generation of CD138+IRF4+ plasma cells (number equals percentage in gate). (D) Percentage and total number of CD138+IRF4+ plasma cells following stimulation with indicated R848 dose. Each point represents an individual experimental animal. (E) Nuclear translocation of NFκB by western blot in sorted female WT and Ncf1−/− MZ B cells after CpG stimulation at indicated times. Western blot of nuclear LSD1 was used as a protein loading control. MW, molecular weight. (F) Quantification of nuclear NF-κB by densitometry, corrected for loading control. MW, molecular weight. (G and H) Representative western blot of cytosolic pERK2 (G) and pERK2 quantification (H) in sorted female WT and Ncf1−/− MZ B cells after CpG stimulation for indicated times. Actin was used to normalize protein loading. Each point represents an independent experiment. (A–H) Bars indicate mean. Data are combined from two (D), four (B and H), and five (F) independent experiments. *, P < 0.05; and **, P < 0.01 by paired (B) or unpaired Student’s t test (D, F, and H). Source data are available for this figure: SourceData F5.

