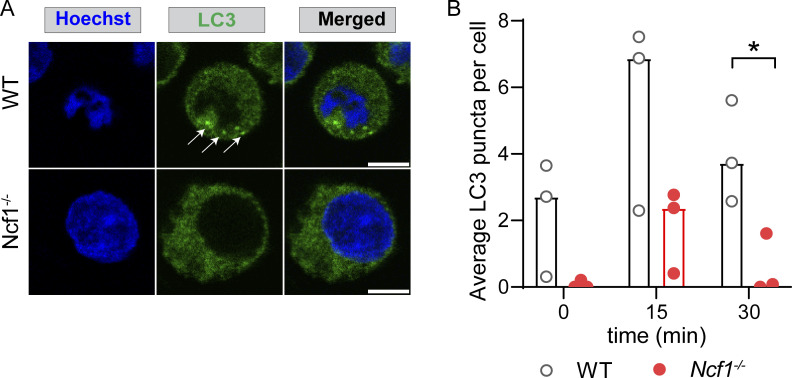
Figure S4.
NCF1 deletion reduces LC3 lipidation in response to R848 stimulation. (A) Confocal microscopy showing LC3 in control and NCF1-deficient HBL1 cells at 15 min after R848 stimulation. Arrows show LC3 puncta in control cells. Scale bar: 5 µm. (B) Quantification of average LC3 puncta per cell in unstimulated control and NCF1-deficient HBL1 cells through 3D analysis. Every dot represents the average puncta per cell for each individual experiment (n = 3 independent experiments). *, P < 0.05 by two-tailed, paired Student’s t test.

