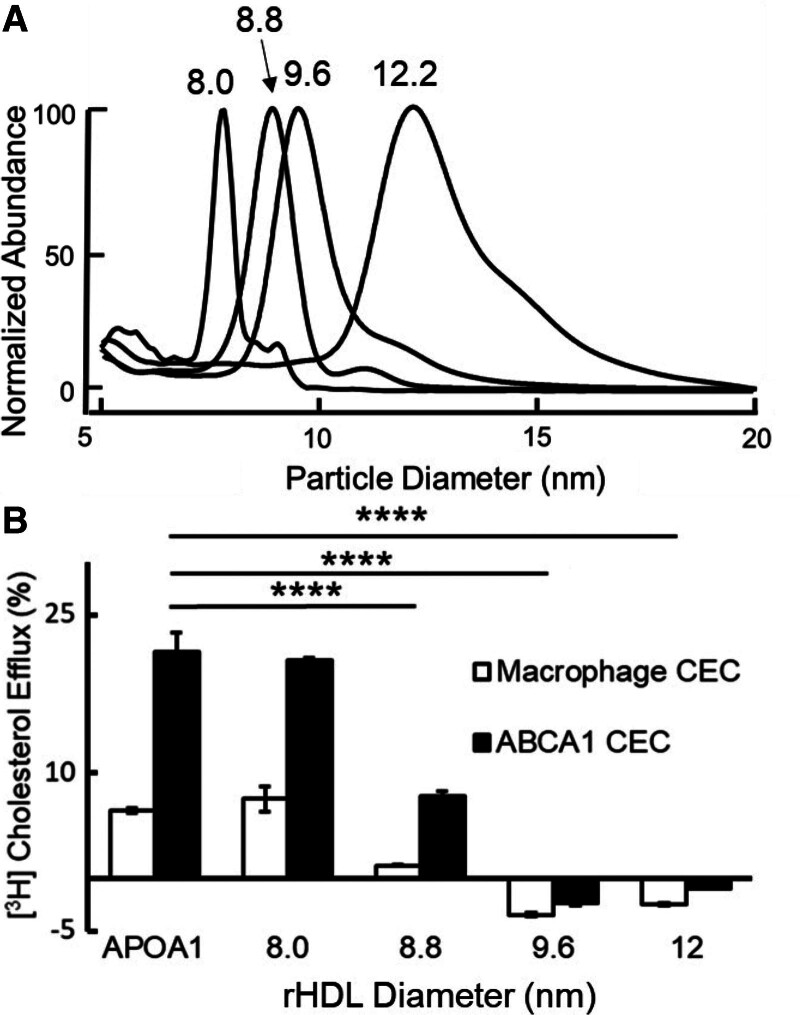
Figure 1.
Calibrated IMA (A) and CEC (B) of reconstituted HDLs (r-HDLs) prepared by cholate dialysis and fractionation by high-resolution size exclusion chromatography. A, Representative IMA profiles of each size of r-HDL. To facilitate comparison of the size distributions of the particles, the height of each r-HDL was set to 100%. The median sizes of the isolated particles were 8.0±0.2 nm, 8.8±0.1 nm, 9.6±0.1 nm, and 12.2±0.1 nm. B, ABCA1-mediated CEC using equimolar concentrations of each size of r-HDL. Macrophage CEC and ABCA1 CEC of serum HDL were quantified after a 4-hour incubation with [3H]cholesterol-labeled J774 macrophages and baby hamster kidney cells, without or with induction of ABCA1 expression with cAMP and mifepristone, respectively. Cholesterol efflux was calculated as the percentage of radiolabel in the medium of the cells divided by the total radioactivity of the medium and cells. CEC was quantified as the difference in cholesterol efflux of cells with and without induced expression of ABCA1. Results are representative of 5 independent experiments with replicate analyses. ****P<0.001, 1-way ANOVA with Tukey-Kramer post-tests. ABCA1 indicates ATP-binding cassette transporter A1; APOA1, apolipoprotein A1; CEC, cholesterol efflux capacity; HDL, high-density lipoprotein; and IMA, ion mobility analysis.

