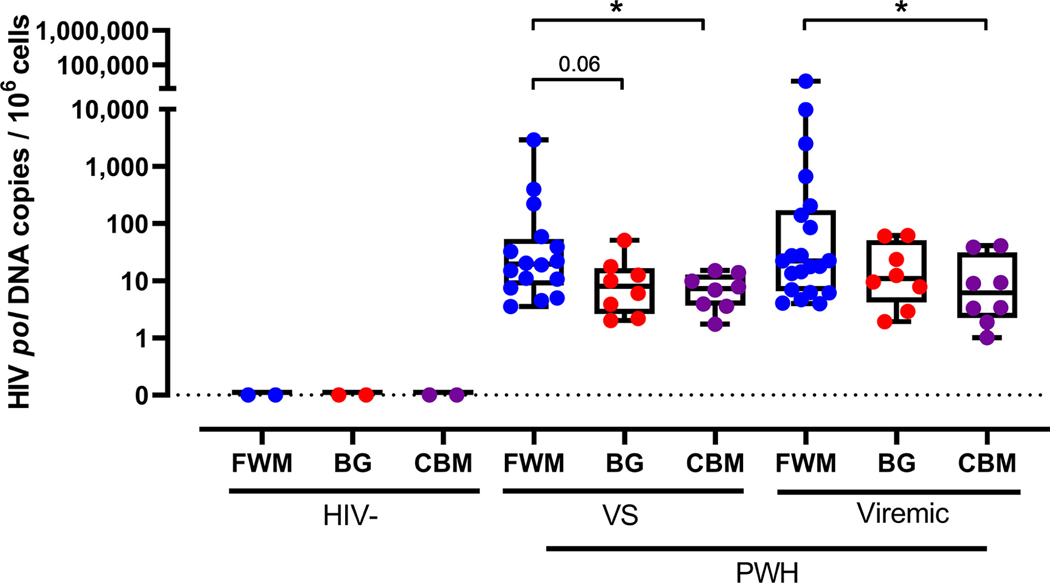
FIGURE 1:
Quantification of HIV pol DNA in human brain regions. HIV pol DNA was quantified in fresh frozen FWM (blue), BG (red), and CBM ( purple) tissue from VS (n = 16) and untreated PWH (viremic; n = 21) or HIV-seronegative controls (HIV-; n = 2) by ddPCR. HIV pol DNA copies standardized to 106 cell equivalents. Median and IQRs shown. Comparisons made using non-parametric Mann–Whitney U tests. *p < 0.05. BG = basal ganglia; CBM = cerebellum; ddPCR = droplet digital polymerase chain reaction; FWM = frontal white matter; IQR = interquartile range; PWH = people with HIV; VS = virally suppressed.

