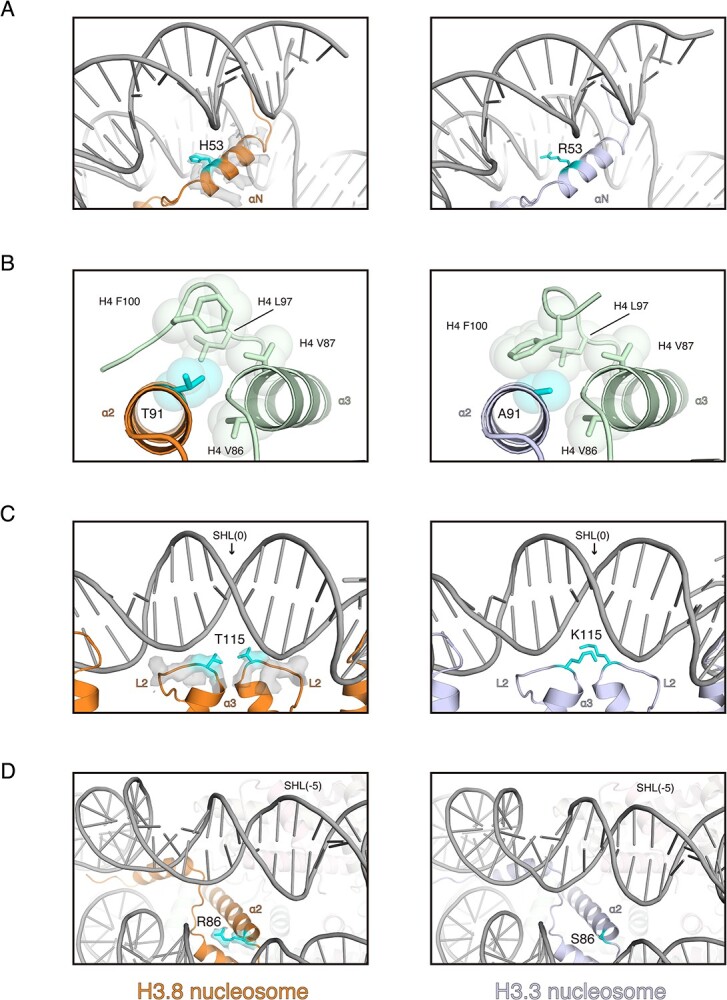
Fig. 5.

Structural comparison of the nucleosomes containing H3.3 and H3.8. (A) Close-up views around the entry/exit DNA regions of the H3.8 nucleosome (left panel) and the H3.3 nucleosome (right panel). The position 53 residues of H3.3 and H3.8 are shown in cyan with side chains. The cryo-EM map of the H3.8 αN helix region is overlaid on the cartoon model. (B) Structural comparison around position 91 in the H3.8 nucleosome (left panel) and the H3.3 nucleosome (right panel). The position 91 residues of H3.3 and H3.8 are shown in cyan with side chains. The van der Waals surfaces of the side chain atoms around the position 91 residues of H3 are represented as spheres. (C) Close-up views around SHL(0) of the H3.8 nucleosome (left panel) and the H3.3 nucleosome (right panel). The position 115 residues of H3.3 and H3.8 are shown in cyan with side chains. The cryo-EM map of the H3.8L2 loop region is overlaid on the cartoon model. (D) Close-up views around SHL(−5) of the H3.8 nucleosome (left panel) and the H3.3 nucleosome (right panel). The position 86 residues of H3.3 and H3.8 are shown in cyan with side chains. The cryo-EM map of the H3.8 Arg86 is overlaid on the cartoon model. The PDB ID of the H3.3 nucleosome structure shown in this figure is 5X7X.
