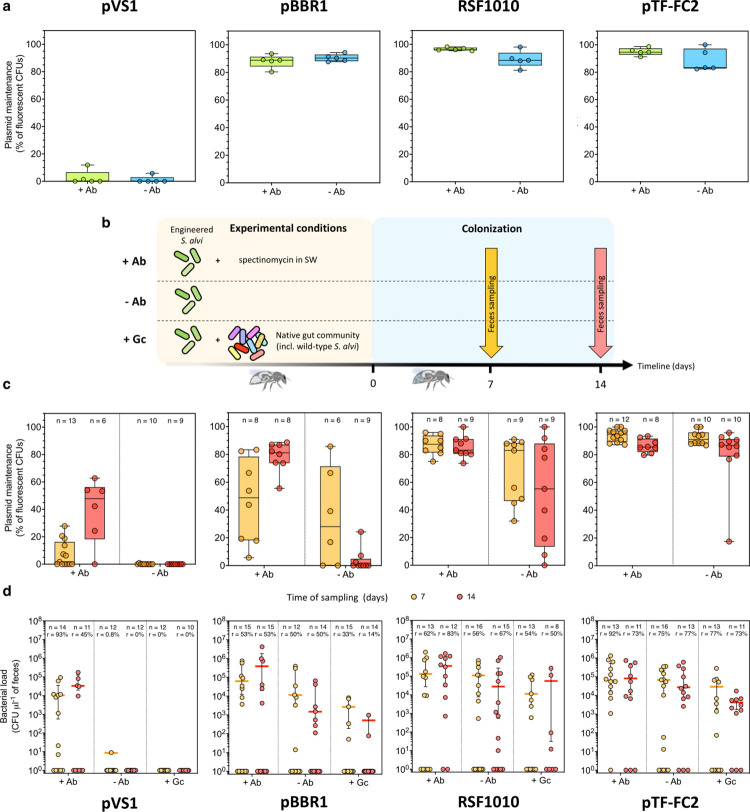
Fig 4. Maintenance of broad-host range plasmids and engineered S. alvi over time.
Each broad-host-range vector has a distinct level of maintenance in S. alvi cells, as demonstrated in vitro (a) and in vivo (c). Box plots represent plasmid maintenance median values of n biological replicates. Plasmid maintenance was estimated by measuring the percentage of fluorescent colony forming units (CFUs) plated onto nonselective media of samples obtained from (a) liquid cultures (in vitro) after 3 days of growth with (+Ab) or without (−Ab) spectinomycin supplementation; or (c) from feces (in vivo) collected 7 (orange) and 14 (red) days after gut monocolonization of bees continuously fed sugar water supplemented with (+Ab) or without (−Ab) spectinomycin. Only samples for which we detected bacterial colonies upon plating the fecal material were considered. (b) Schematic outline of the in vivo experiment to estimate engineered S. alvi colonization maintenance. Arrows indicate the 2 times of feces sampling. (d) Bacterial load of engineered S. alvi cells found in feces collected 7 (orange) and 14 (red) days after gut monocolonization of bees continuously fed sugar water supplemented with (+Ab) or without (−Ab) spectinomycin. Concentrations of our different S. alvi strains isolated from the feces of bees co-colonized with the natural gut community and that were fed sugar water without spectinomycin (+Gc) was also analyzed. Those CFUs values were obtained by plating diluted feces onto selective media (i.e., supplemented with spectinomycin). Bees for which we did not detect engineered bacteria were considered noncolonized individuals. The rate of colonized bees (r) and the number of bees sampled (n) are provided. Corresponding median values of colonized bees only are represented by colored horizontal bars with interquartile ranges. Plasmids used for all panels in S. alvi were pAC10, pAC04, pBTK570, and pAC11, carrying the pVS1, pBBR1, RSF1010, and pTF-FC2 origins of replication, respectively. The data underlying this Figure can be found in the S1 Data file, sheets “Fig 4A,” “Fig 4C,” and “Fig 4D”.

