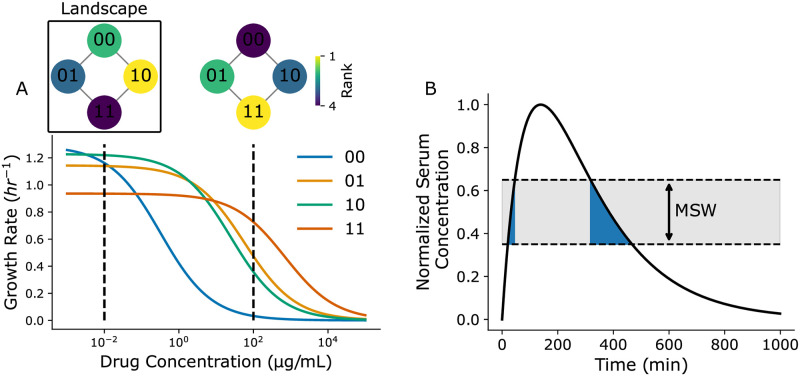
Fig 1. Illustrations of fitness seascapes and mutant selection windows.
(A) Example fitness seascape parameterized with random dose-response data. Genotypes are modeled with binary strings, where ‘0’ represent the absence of a point mutation at a specific position and ‘1’ represents the presence of said mutation. Corresponding rank-order fitness landscapes are annotated at 10−2 and 102 μg/mL. (B) Example patient serum drug concentration profile over time for a single drug dose. The mutant selection window range is annotated in gray, while the time the serum drug concentration resides within the mutant selection window, tMSW, is shown in blue.

