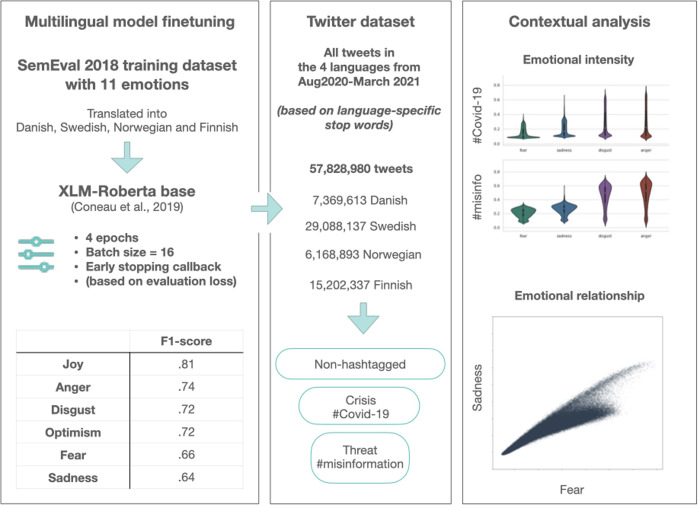
Fig 1. Overview of the analysis pipeline.
Left: XLM-RoBERTa base was fine-tuned using the SemEval 2018 training dataset (subtask 5) translated into the Nordic languages present in our data. We filtered for emotions that obtained an f1-score of above .6 as a minimum standard for model performance. Middle: Data was scraped for the time period between August 2020 and March 2021 based on language specific stopwords, reaching a total of 57,828980 tweets. From that sample we extracted 1) a sample of tweets not containing hashtags (non-hashtagged) 2) a #Covid-19 subsample 3) a #Misinformation subsample. Right: Overview of emotions in the data in order to characterise the Nordic Twittersphere and statistical analyses to compare non-hashtagged vs. #Covid-19 and #Covid-19 vs. #Misinformation.

