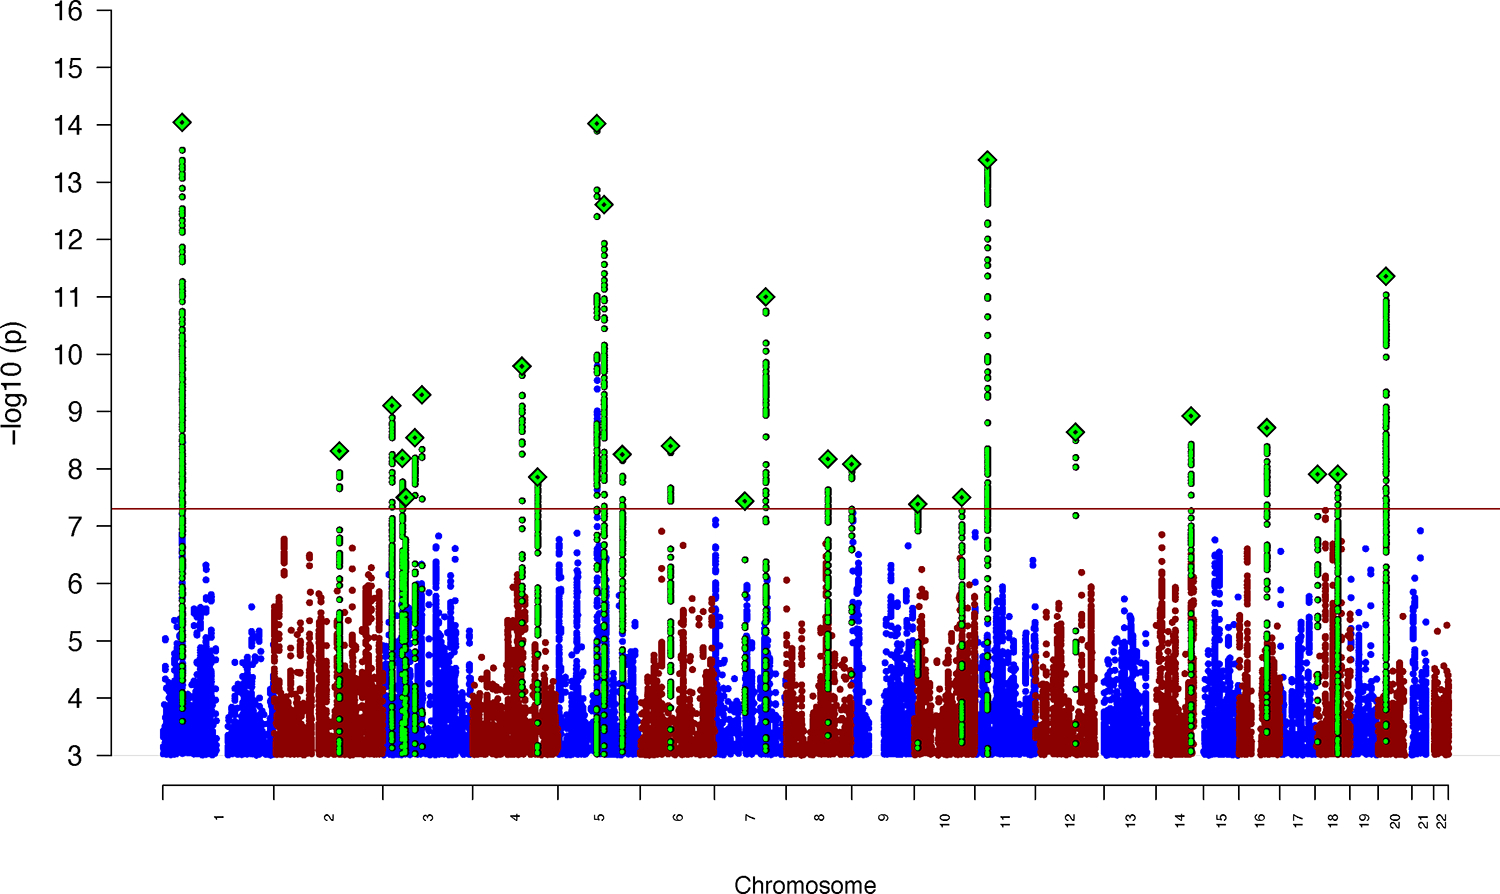
Figure 1 |. Results from GWAS meta-analysis of iPSYCH, deCODE and PGC cohorts including 38,899 cases and 186,843 controls in total.

The y-axis represents −log10(two-sided P-values) from meta-analysis using an inverse-variance weighted fixed effects model. Index variants in each of the genome-wide significant loci are marked as a green diamond (note that two loci on chromosome 3, index variants rs7613360 and rs2311059, are located in close proximity and therefore appear as one diamond in the plot). The red horizontal line represents the threshold for genome-wide significant association (P = 5 × 10⁻⁸).
