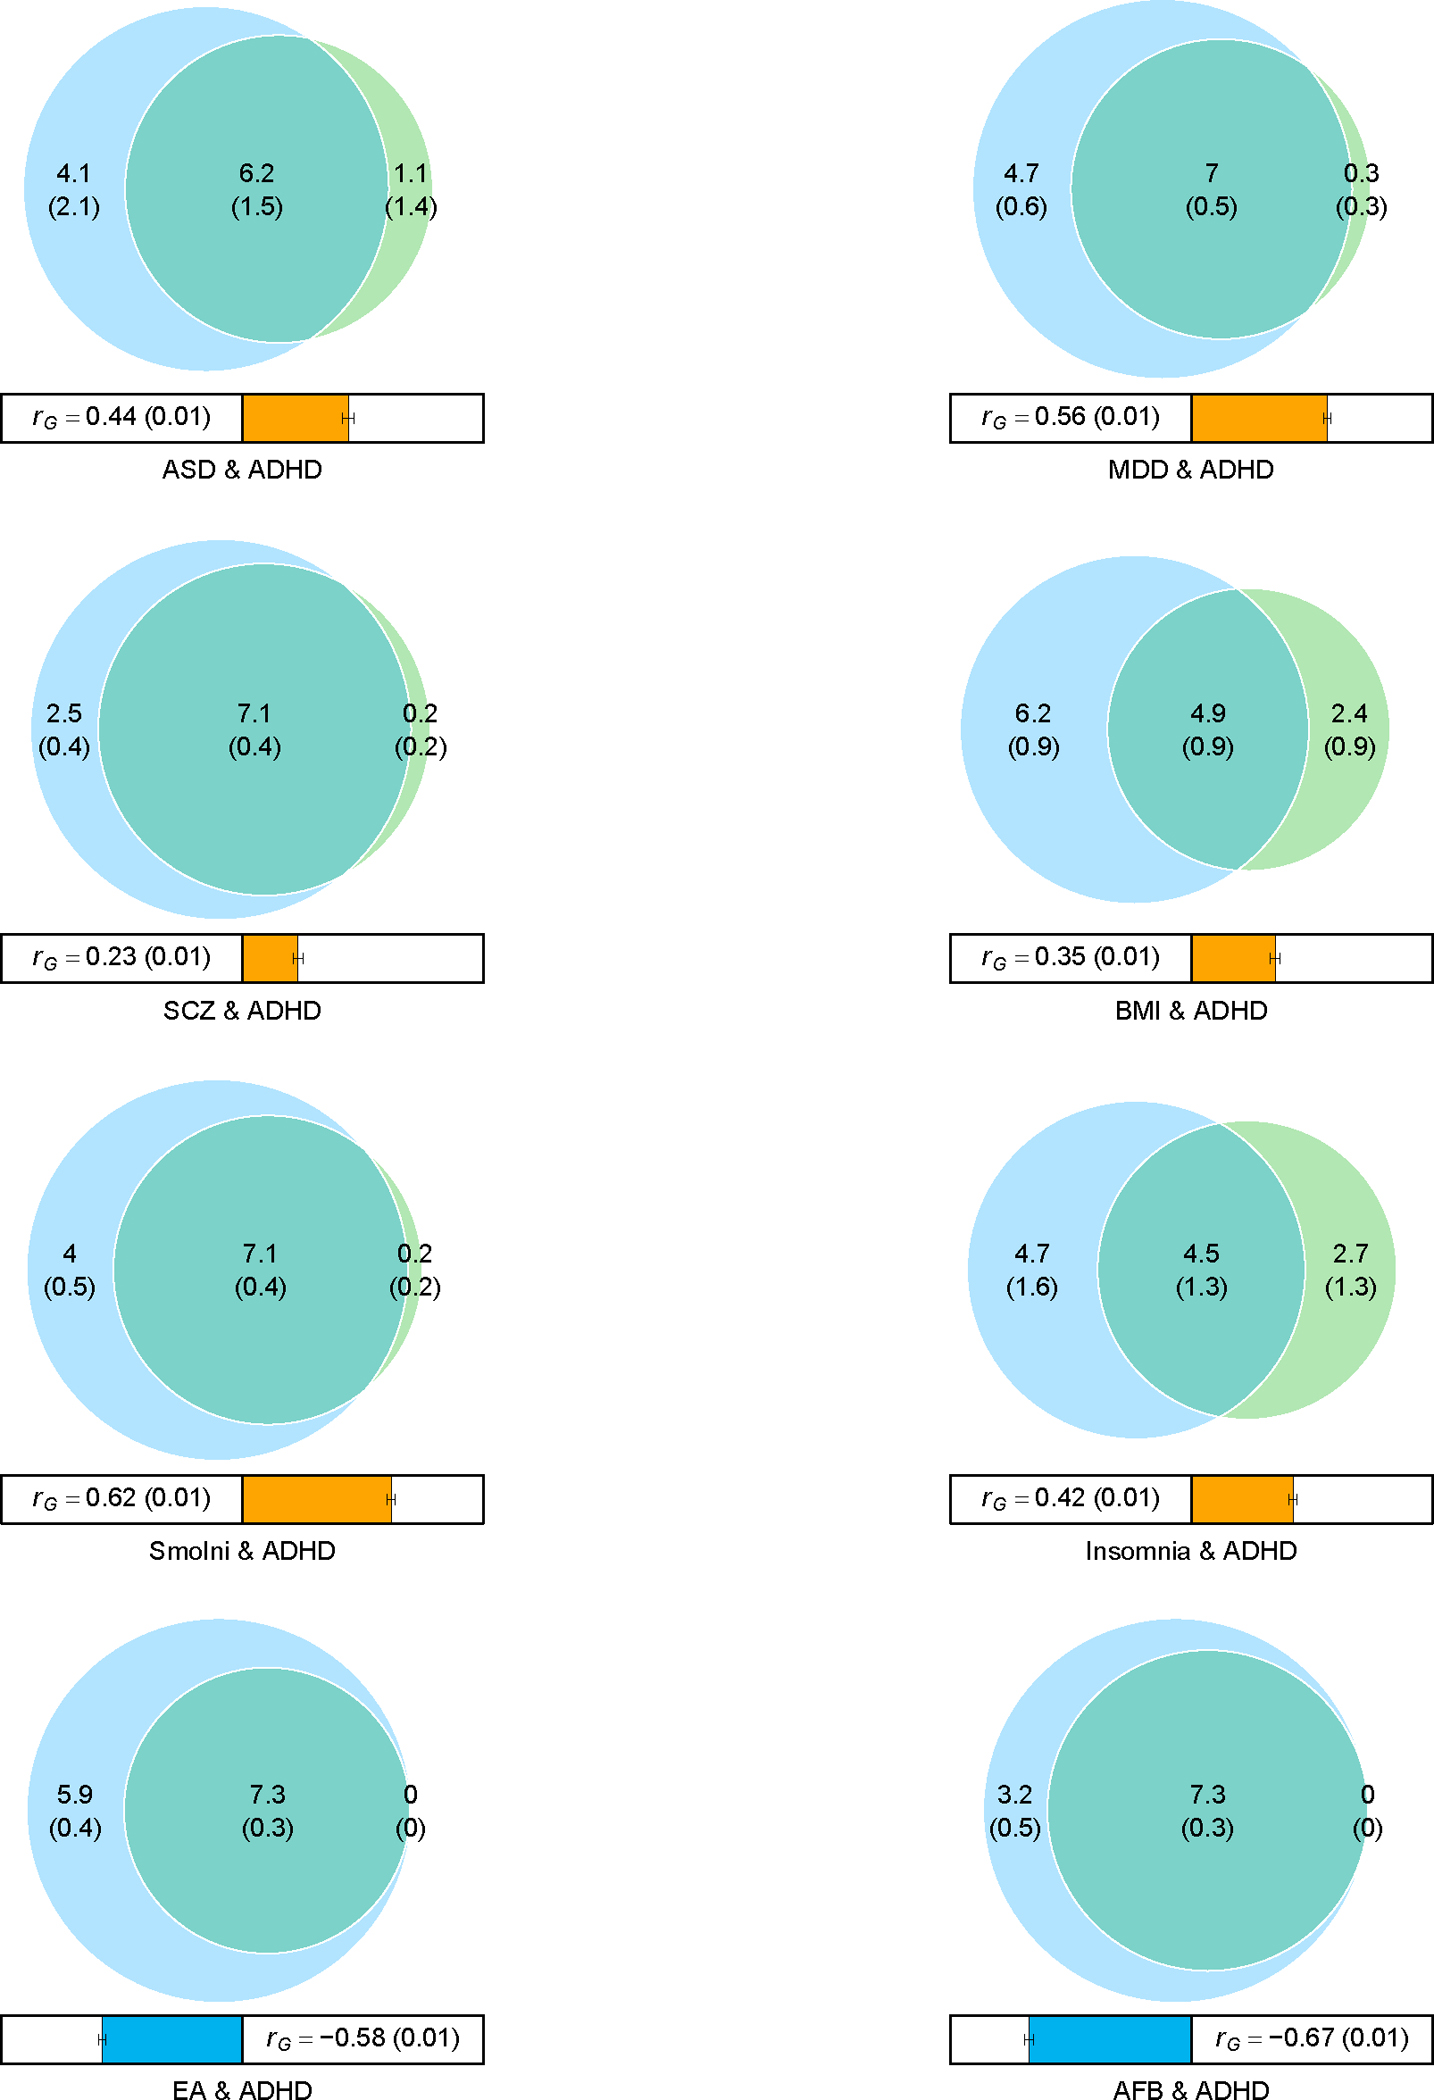
Figure 2 |. Venn diagrams showing MiXeR results of the estimated number of variants shared between ADHD and psychiatric disorders (with significant genetic correlations with ADHD) and phenotypes representing other domains with high genetic correlation with ADHD.

Circles represent shared variants (gray), unique to ADHD (light blue) and unique to the other phenotype of interest (orange). The number of shared variants (and standard deviations) is shown in thousands. The size of the circles reflects the polygenicity of each phenotype, with larger circles corresponding to greater polygenicity. The estimated genetic correlation (rg) between ADHD and each phenotype from LDSC is shown below the corresponding Venn diagram, with an accompanying scale (−1 to +1) with blue and red representing negative and positive genetic correlations, respectively. Bivariate results for ADHD, autism spectrum disorder (ASD), major depressive disorder (MDD), schizophrenia (SCZ), body mass index (BMI), smoking initiation (SmoIni), insomnia, educational attainment (EA) and age at first birth (AFB) are shown (see also Supplementary Table 17).
