
Figure 3 |. Association of ADHD-PGS with measures of cognitive abilities in the PNC cohort (n = 4,973).
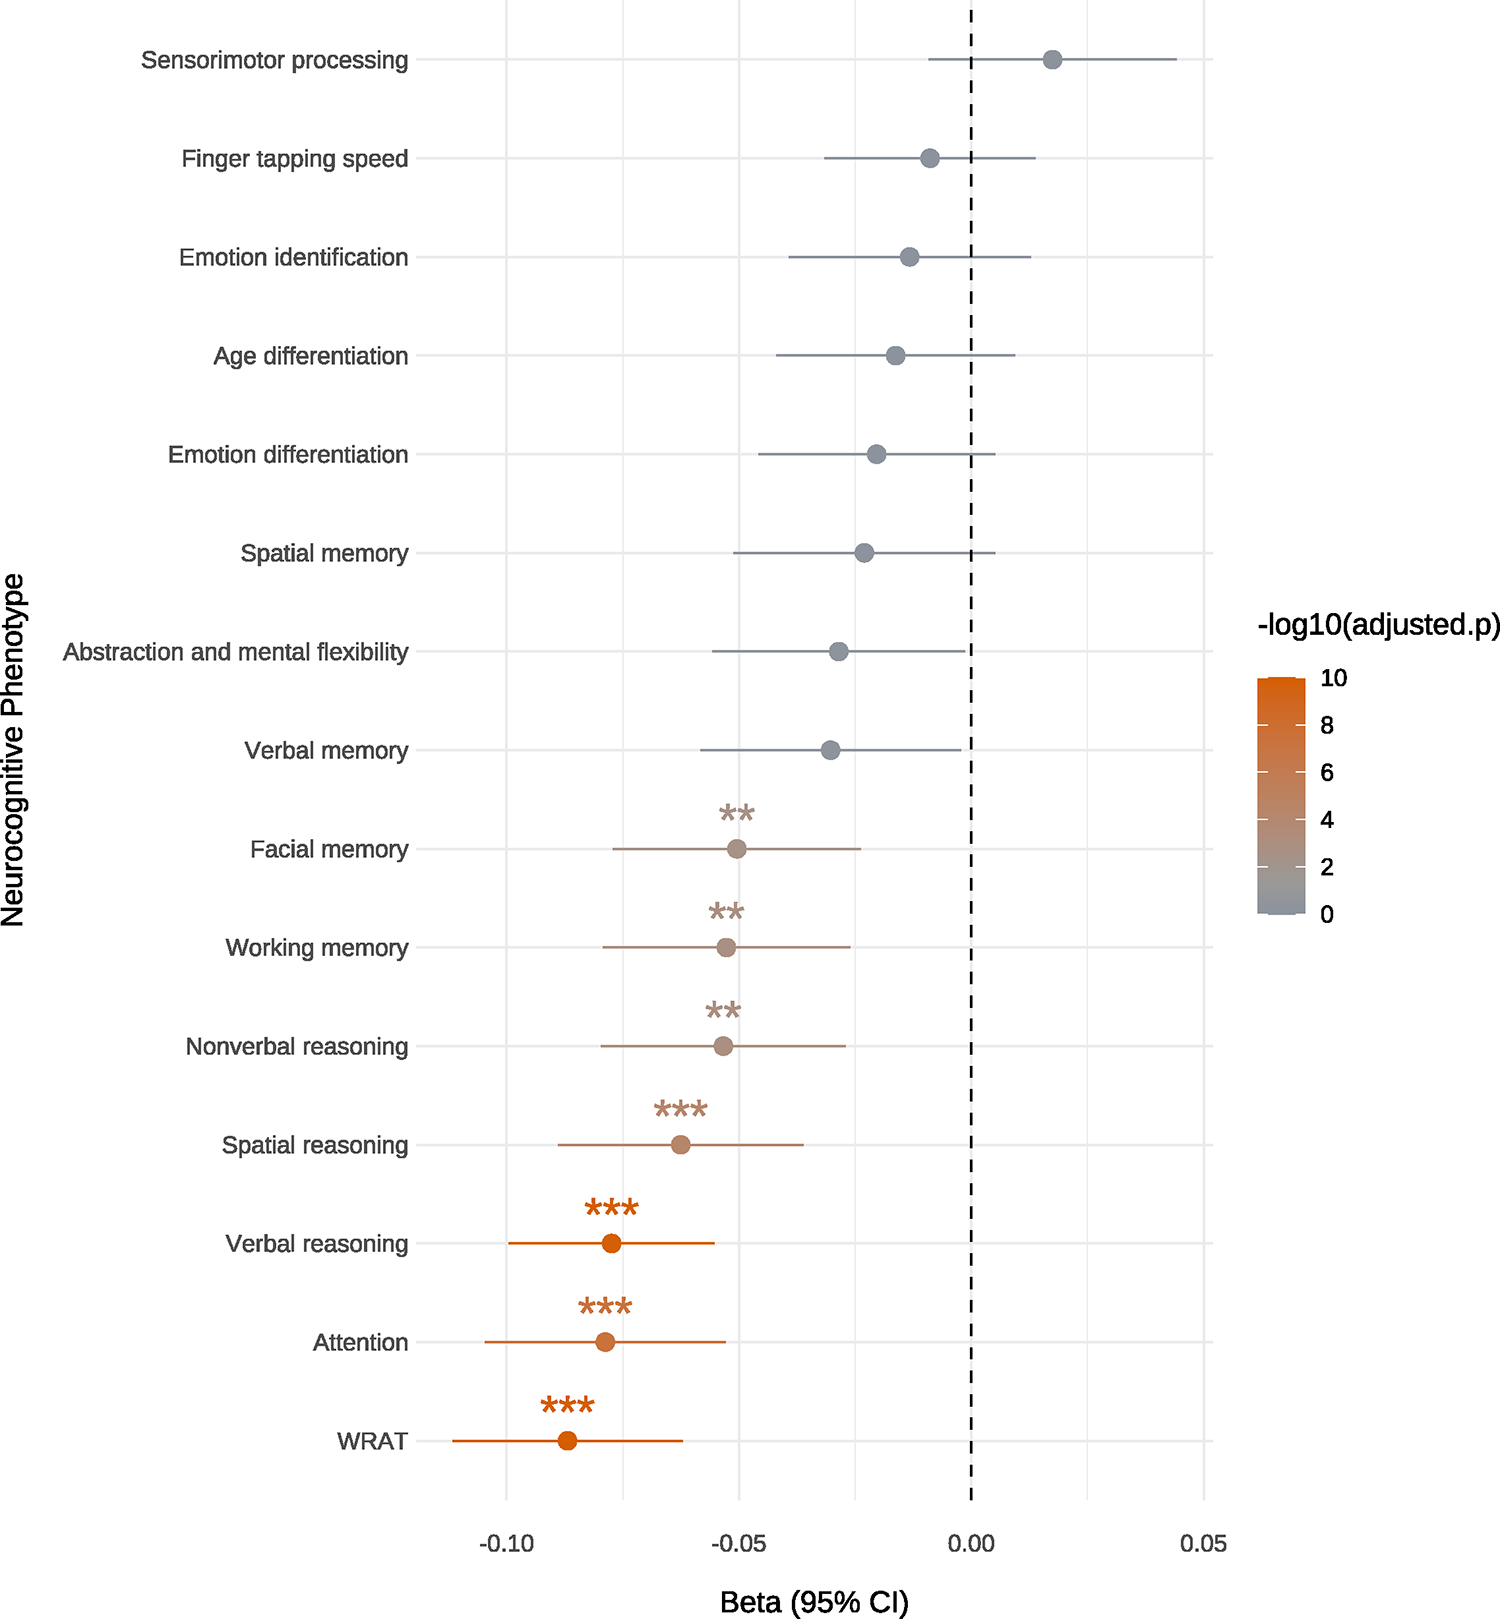
Beta values (represented as a dot and standard errors indicated as horizontal bars) from linear regression testing for the association of ADHD-PGS with the 15 neurocognitive measures listed on the y-axis (Wide Range Achievement Test-4 (WRAT). The color bar at the right indicates the −log10(Bonferroni adjusted two-sided P-value) and P-value thresholds are indicated by stars (*P = 0.05; **P = 0.01, ***P = 0.001).