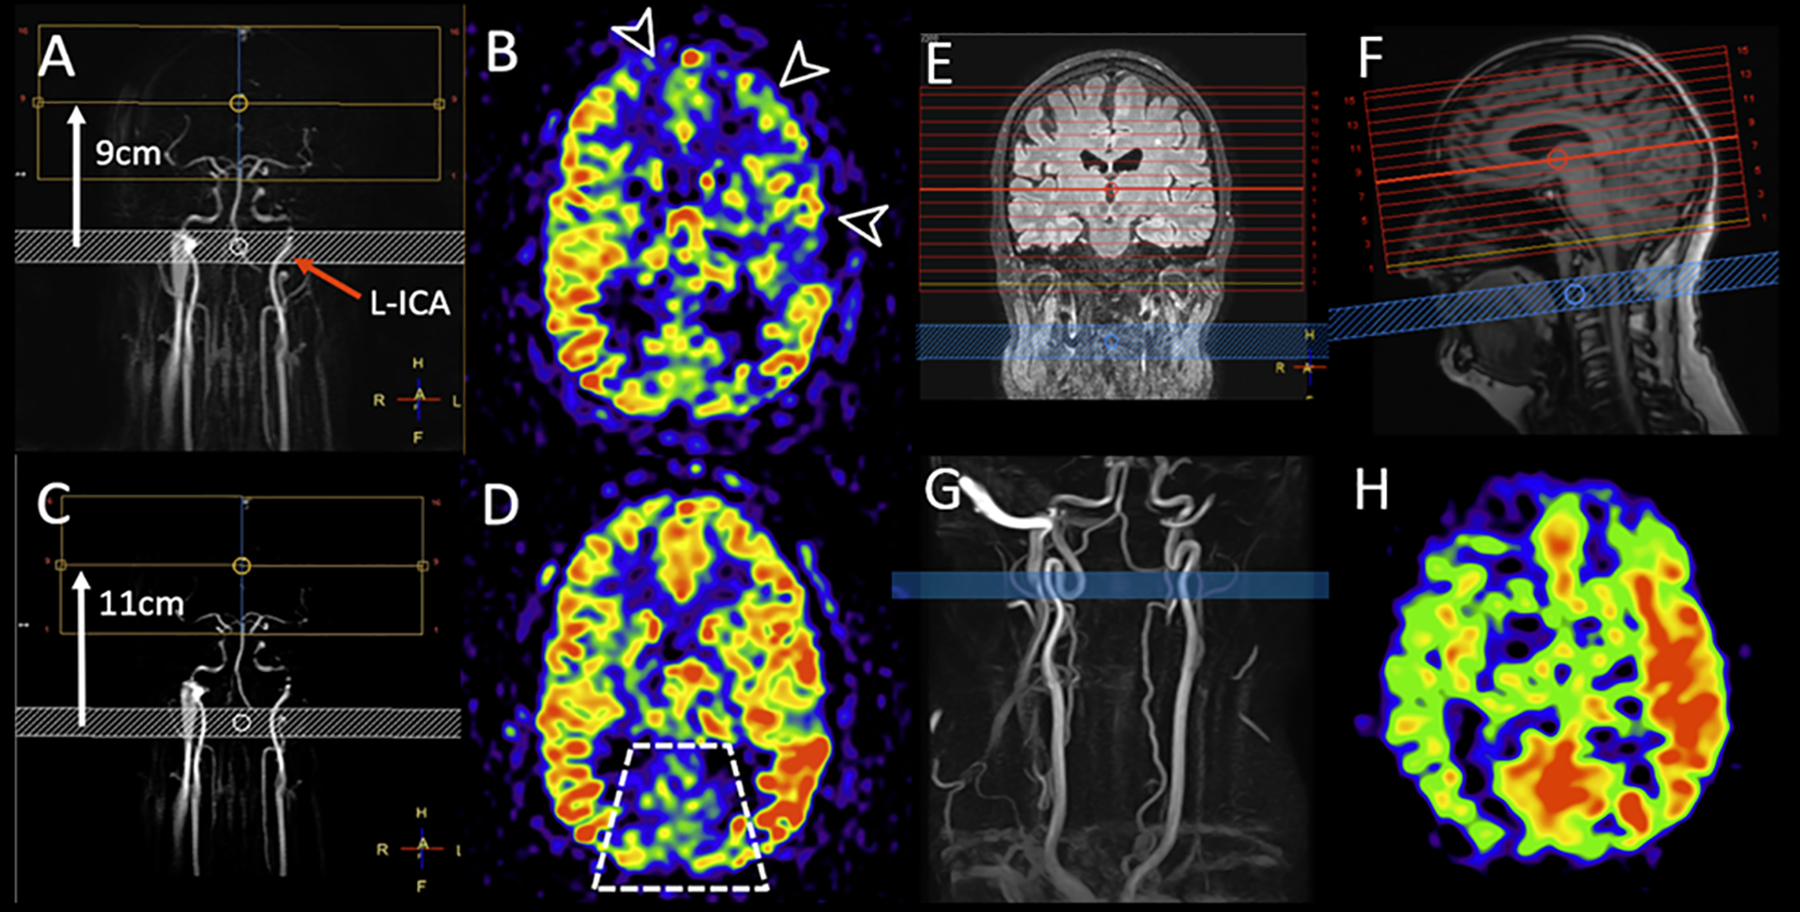
Figure 2:

Two examples of the effect of labeling asymmetry on the CBF images (CBF values are not indicated).
A-D: Two consecutive 3D PCASL scans were acquired in the same MRI exam in a patient at a chronic stage of carbon monoxide intoxication. Both scans were planned on a 2D coronal phase contrast MRA (A and C). B and D show the same imaging slice position. In the first run (top row) the labeling distance was 9cm (white arrow on A). Extensive low signal is seen in the territories of the left middle cerebral artery (MCA) and bilateral anterior cerebral arteries (ACA) (arrow heads on B). On the second run (bottom row) the labeling plane was moved down by 2cm, while the other sequence parameters were unchanged. Note that the left ICA (red arrow) is more obliqued relative to the labeling plane on A, while it is more perpendicular to the labeling plane and symmetrical to the right ICA on C. On the second PCASL scan, most of the previously abnormal areas demonstrate increased perfusion, more symmetric with the remainder of anterior circulation territories. This is a case of labeling asymmetry that was corrected with the repositioning of the labeling plane. Also note that the PCA territories show lower signal on both perfusion maps (trapezoid on D), which is a physiological ASL phenomenon often referred to as pseudo-hypoperfusion. It can be observed with the standard (non-fetal) configuration of the posterior cerebral arteries (PCA), with P1 segments arising from the basilar artery, and it is likely caused by a lower labeling efficiency of the vertebral arteries blood flow compared to the ICAs. (Adapted from Pinter et al. (30).
E-H: Example of asymmetric perfusion without obvious reason. The planning screenshots (E and F) show the labeling plane (blue) and image volume (red). No hemodynamically relevant stenoses are visible on the neck time-of-flight angiography (G). However, upon closer inspection of the planning angiogram, it was noted that the labeling plane was placed in a tortuous loop of the right ICA. The left ICA was labeled in a straight section, perpendicular to the labeling plane. The final CBF weighted images (H) result in a visible perfusion asymmetry, which could lead to a false positive diagnosis when the underlying reason cannot be determined. Such anatomical variants might not be known in patients, and this example illustrates well the value of providing the planning strategy for interpreting the final ASL images.
