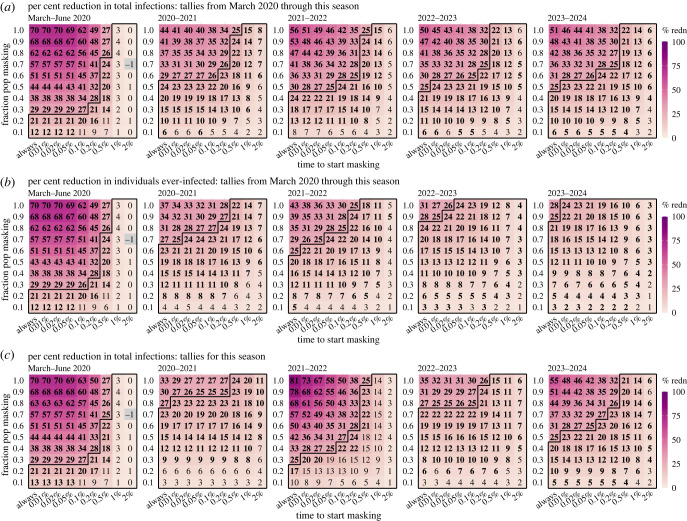
Figure 2.
Estimated effectiveness of masking in reducing infection rates at the population level (main analysis assuming an R0 of 2.6 and no masking at home). Heatmaps show (a) per cent reduction of cumulative total infections from March 2020 through different seasons (see panel subtitles, same below), (b) per cent reduction of the cumulative fraction of population ever-infected, i.e. regardless of number of (re)infections, and (c) per cent reduction of total infections tallied for each season. Here, a season runs 1 year from 1 July to 30 June of the following year. Numbers in the cells show median effectiveness estimates (computed per equation (4.2)) for the corresponding masking rate (y-axis) and timing of masking (x-axis, percentages show population infection prevalence when masking is enacted). Bold fonts indicate the 2.5th % of the estimate is above 0 (i.e. significant at a = 0.05 level); note the 95% intervals here are probably narrower than measures in RCTs as the model assumes all infections are identified for the entire population. Negative values (i.e. increases; see grey cells) are possible due to model stochasticity (N.B., none are significant at a = 0.05 level). The black lines delineate cells with a median effectiveness estimate less than 25%.

