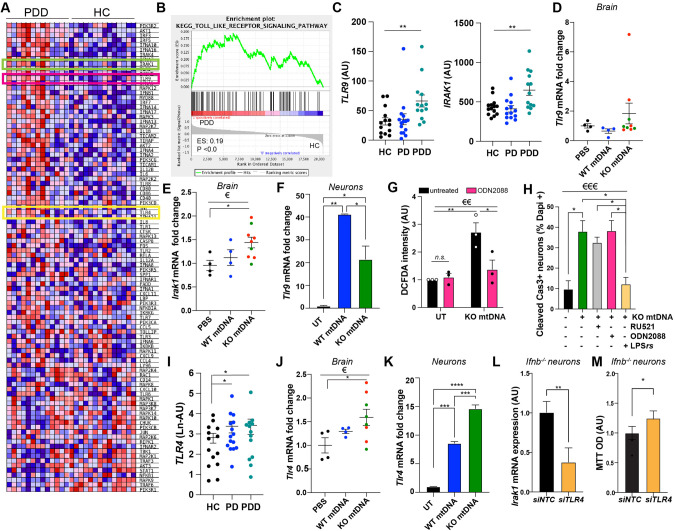
Fig. 5. TLR9 signalling is upregulated in PDD patient and triggers oxidative stress in neurons, while TLR4 triggers neuronal death.
A Heat map from GSEA of the TLR signalling pathway and comparing microarray data from sPDD (N = 13) and HC (N = 14). TLR9 is circled in green and TLR4 in yellow. B Enrichment plot of the TLR signalling pathway. C Expression of TLR9 and IRAK1 in HC and PDD patients extracted from (A). D, E mRNA levels of (D). Tlr9 and (E). Irak1 in mice injected with either PBS (N = 4), WTmtDNA (N = 4) or KO mtDNA (N = 9), (F) mRNA levels of Tlr9 in primary CNs untreated or treated with either WT mtDNA or KO (Ifnb−/−) mtDNA. One representative of 3 independent experiments. G Normalized DCFDA integrated density quantification wild-type neurons treated with KOmtDNA with or without the presence of TLR9 inhibitor ODN2088. H Quantification of cCas3 staining in WT neurons treated with KOmtDNA with or without the presence of cGAS inhibitor RU521, TLR4 inhibitor LPS rs or ODN2088. Immunofluorescence staining in S5D. G, H N = 3. I Expression of TLR4 in HC and PDD patients extracted from (A). J mRNA levels of Tlr4 in mice injected with either PBS (N = 4), WTmtDNA (N = 4) or KOmtDNA (N = 9). K mRNA levels of Tlr4 in primary CNs untreated or treated with either WTmtDNA or KO (Ifnb−/−) mtDNA. One representative of 3 independent experiments. L Irak1 expression in Ifnb−/− CNs NTC or knock-down for Tlr4. M Viability of Ifnb−/− CNs NTC or knock-down for Tlr4 assessed by MTT staining. For all graphs, 1 dot means 1 individual animal. For (D, E and J) PBS injected mice are shown in black, WTmtDNA in blue, and KOmtDNA in green (Ifnb−/−mtDNA) and red (Ifnar1 −/−mtDNA), N = 4/group. €€ means p < 0.01 and €€€ p < 0.001 by ordinary one-way ANOVA, Krustal–Wallis ANOVA if distribution did not show Gaussian distribution (Shapiro–Wilk test) or Brown-Forsythe ANOVA if distribution showed SD differences (Bartlett’s test). G Was analyzed by 2way-ANOVA. * means p < 0.05 and ** p < 0.01, *** p < 0.001, and **** p < 0.0001 by post-hoc unpaired t-test.

