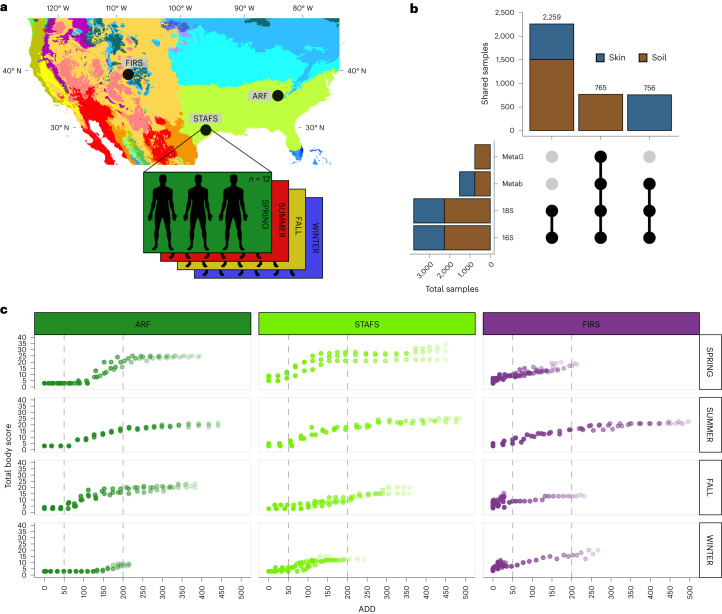
Fig. 1. Summary of study design.
a, Köppen–Geiger climate map showing ARF and STAFS as ‘temperate without a dry season and hot summer’ and FIRS as ‘arid steppe cold’ adapted from ref. 23. Thirty-six cadavers in total were placed (N = 36), 3 per season for a sum of 12 at each location. b, Upset plot representing the experimental design for the total sample size (x axis) and number of shared/paired samples (y axis) for each data type. MetaG, metagenomics; Metab, metabolomics; 18S, 18S rRNA amplicon; 16S, 16S rRNA amplicon. c, Total body score, a visual score of decomposition calculated over the course of decomposition27, illustrating how decomposition progresses at each location and by season in triplicate. Dashed lines separate sections of early, active and advanced stages of decomposition as determined by a temperature-based unit of time, accumulated degree day (ADD), calculated by continuously summing the mean daily temperature above 0 °C from left to right. Point transparency increases with days since placement.

