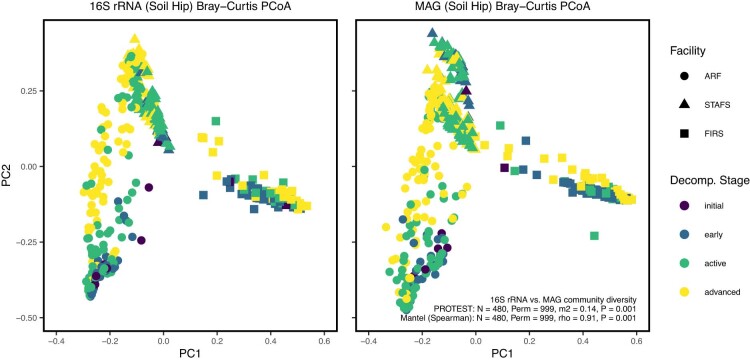
Extended Data Fig. 10. Diversity Comparison between 16S rRNA and Metagenomic Data.
PCoA ordination plots of Bray-Curtis dissimilarity matrices calculated from paired rarefied 16S rRNA feature abundances (left) and TPM-normalized MAG abundances (right) from the soil adjacent to the hip. Procrustes/PROTEST and mantel tests were performed between the PCoA ordinances and distance matrices, respectively. n = 480 biologically independent samples, respectively.

