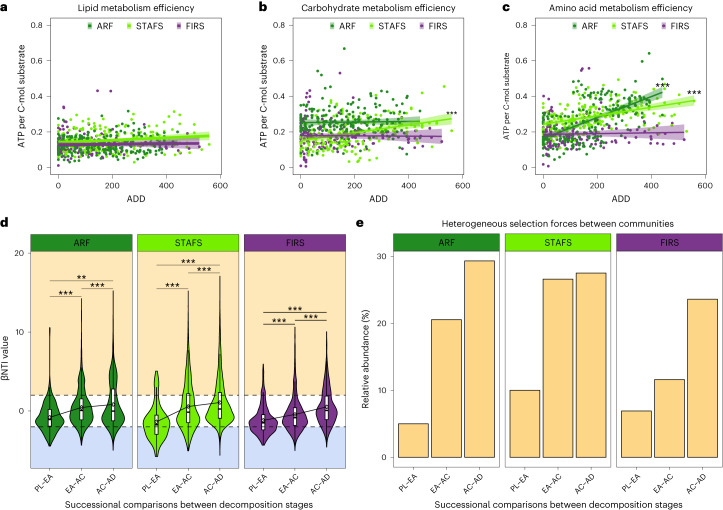
Fig. 2. Decomposer community assembly is governed by stochastic and deterministic bacterial assembly processes.
a–c, Lipid (a), carbohydrate (b) and amino acid (c) metabolism efficiency as determined by the maximum ATP per C-mol of substrate that can be obtained from each community, plotted against the ADD the community was sampled. ARF n = 212, STAFS n = 198 and FIRS n = 158 biologically independent samples. Data are presented as mean ± 95% confidence interval (CI). Significance was tested with linear mixed-effects models within each location including a random intercept for cadavers with two-tailed ANOVA and no multiple-comparison adjustments. ARF amino acids P = 6.27 × 10⁻²³, STAFS amino acids P = 6.626 × 10⁻¹⁰, STAFS carbohydrate P = 2.294 × 10−07 and STAFS lipid P = 3.591 × 10−02. d, Pairwise comparisons to obtain βNTI values focused on successional assembly trends by comparing initial soil at time of cadaver placement to early decomposition soil, then early to active and so on (PL, placement; EA, early; AC, active; AD, advanced) in the 16S rRNA amplicon dataset, showing that strong selection forces are pushing the community to differentiate. ARF n = 232, STAFS n = 202 and FIRS n = 182 biologically independent samples. In boxplots, the lower and upper hinges of the box correspond to the first and third quartiles (the 25th and 75th percentiles); the upper and lower whiskers extend from the hinge to the largest and smallest values no further than 1.5× interquartile range (IQR), respectively; and the centre lines represent the median. The βNTI mean (diamond symbol) change between decomposition stage is represented by connected lines. Dashed lines represent when |βNTI| = 2. A |βNTI| value < 2 indicates stochastic forces (white background) drive community assembly. βNTI values <−2 and >2 indicate homogeneous (blue background) and heterogeneous (yellow background) selection drive assembly, respectively. The width of the violin plot represents the density of the data at different values. Significance was tested with Dunn Kruskal–Wallis H-test, with multiple-comparison P values adjusted using the Benjamini–Hochberg method. e, Representation of heterogeneous selection pressure relative abundance within the total pool of assembly processes increases over decomposition in the 16S rRNA amplicon dataset. Bars were calculated by dividing the number of community comparisons within with βNTI > +2 by the total number of comparisons. *P < 0.05, **P < 0.01 and ***P < 0.001.

