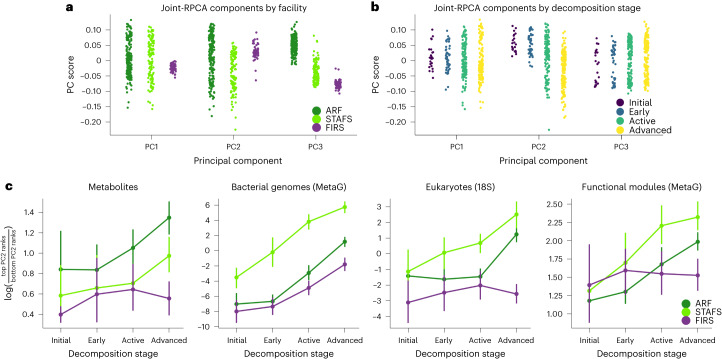
Fig. 4. Multi-omics joint-RPCA principal component values.
a,b, Principal component values show that (a) facility variation is primarily explained by principal component 3 (PC3) (that is, least overlap between group scores), while variation caused by (b) decomposition stage is explained by PC2. c, Change in log ratio of PC scores within omics datasets (metabolites, MAG abundances, 18S rRNA gene abundances and MAG gene functional modules) from initial soil through advanced decomposition stage soil highlights that decomposition stage progression corresponds to compositional shifts. All data types used the same n = 374 biologically independent samples. Data are presented as mean ± 95% CI.

