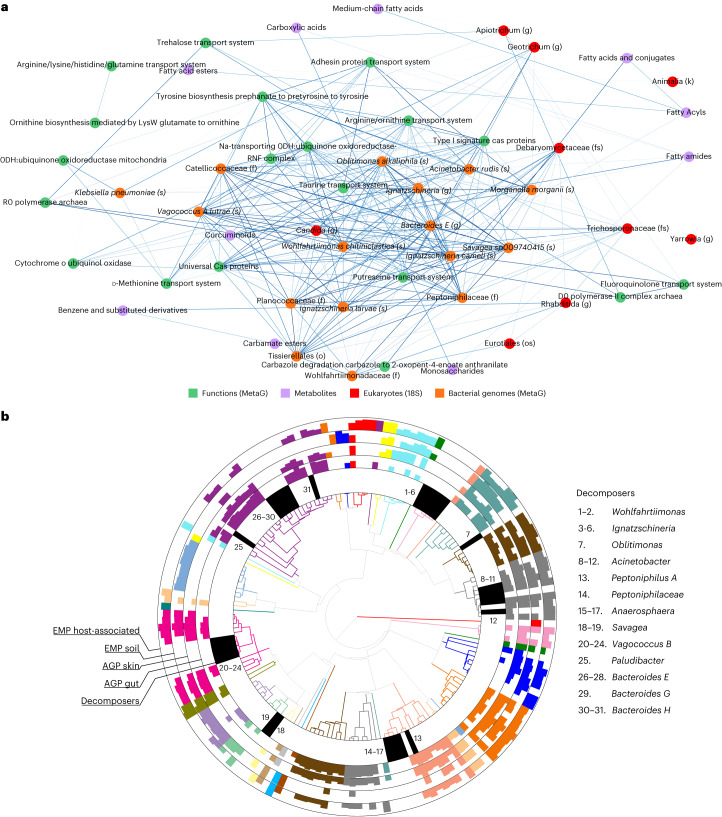
Fig. 5. A universal decomposer network emerges across season, location and climate.
a, Top 20% correlation values from features responsible for the universal late decomposition log-ratio signal in joint-RPCA PC2 visualized in a co-occurrence network. b, Phylogenetic tree representing ASVs associated with key decomposer nodes from the network placed along the top 50 most abundant ASVs taken from AGP gut, AGP skin, EMP soil and EMP host-associated datasets demonstrates that key decomposers are largely phylogenetically unique. Colour represents taxonomic order (full legend in Extended Data Fig. 6); the innermost ring represents decomposer placement, while outer rings represent AGP and EMP ASVs, for which bar height represents ASV rank abundance within each environment. A lack of bars indicates that the ASV was not present within the entire dataset. AGP and EMP ASVs were ranked according to the number of samples they were found in each environment. Decomposer ASVs are numbered clockwise (full taxonomy available in Supplementary Table 27).

