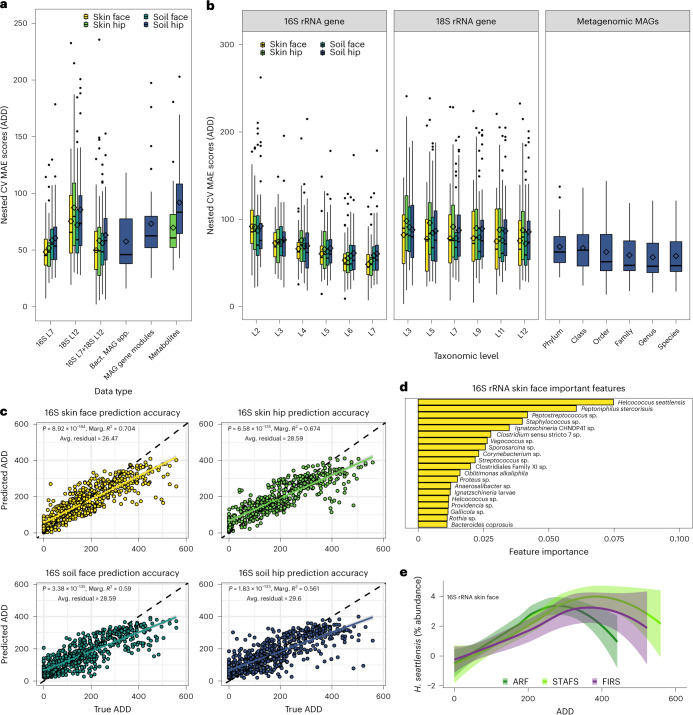
Fig. 6. Machine learning reveals predictive nature of microbial communities of time since death (ADD) through universal decomposers.
a, Cross-validation errors of multi-omic data sets. 16S and 18S rRNA gene data were collapsed to SILVA taxonomic level 7 (L7) and 12 (L12). Boxplots represent average prediction MAE in ADD of individual bodies during nested cross-validation of 36 body dataset. 16S rRNA soil face, soil hip, skin face and skin hip datasets contain n = 600, 616, 588 and 500 biologically independent samples, respectively. 18S rRNA soil face, soil hip, skin face and skin hip datasets contain n = 939, 944, 837 and 871 biologically independent samples, respectively. Paired 16S rRNA+18S rRNA soil face, soil hip, skin face and skin hip datasets contain n = 440, 450, 428 and 356 biologically independent samples, respectively. MAG datasets contain n = 569 biologically independent samples. Metabolite soil hip and skin hip datasets contain n = 746 and 748 biologically independent samples, respectively. b, Mean absolute prediction errors are lowest when high-resolution taxonomic data are used for model training and prediction. Data represented contain the same biologically independent samples as in a. In boxplots in a and b, the lower and upper hinges of the boxplot correspond to the first and third quartiles (the 25th and 75th percentiles); the upper and lower whiskers extend from the hinge to the largest and smallest values no further than 1.5× IQR; the centre lines represent the median; the diamond symbol represents the mean. c, Linear regressions of predicted to true ADDs to assess model prediction accuracy show that all sampling locations significantly predict ADD. Data represented contain the same biologically independent samples as in a. Data are presented as mean ± 95% CI. Black dashed lines represent ratio of predicted to real ADD predictions at 1:1. The coloured solid lines represent the linear model calculated from the difference between the predicted and real ADD. d, The most important SILVA L7 taxa driving model accuracy from the best-performing model derived from 16S rRNA gene amplicon data sampled from the skin of the face. e, Comparison of abundance changes of the top important taxon, Helcococcus seattlensis, in skin reveals that low-abundance taxa provide predictive responses. Data plotted with loess regression and represent the same biologically independent samples as in a. Data are presented as mean ± 95% CI. Bact., bacterial; Avg., average; Marg., marginal.

