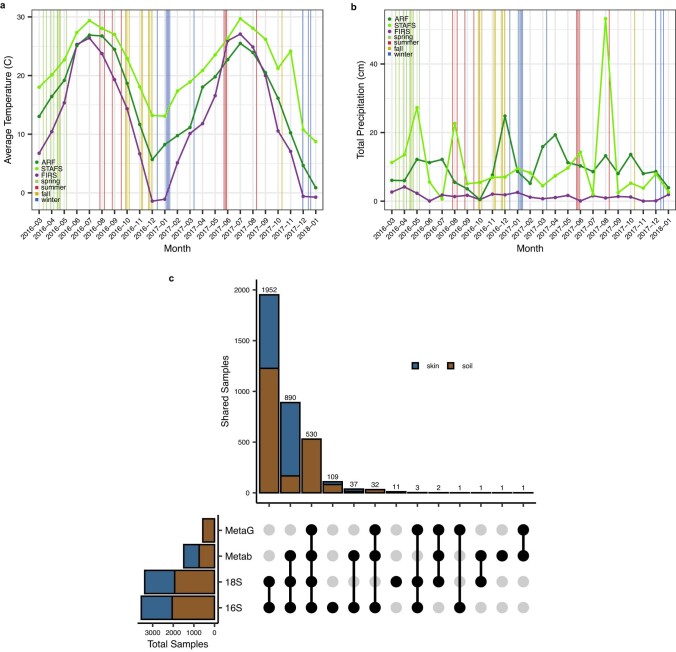
Extended Data Fig. 1. Study Information.
Average a) temperature data and b) total precipitation per location over experiment with cadaver placement dates. Temperature data was collected from local weather stations reported to the National Centers for Environmental Information. Total monthly precipitation data was collected from Weather Underground. The vertical line represents the date of placement and line color denotes the season the body placement is considered to have been placed. c) Upset plot illustrating the intersections between sample and omic types after extractions, processing and quality filtering that were used for further analyses. MetaG = metagenomics, Metab = metabolomics, 18S = 18S rRNA amplicon, and 16S = 16S rRNA amplicon.

