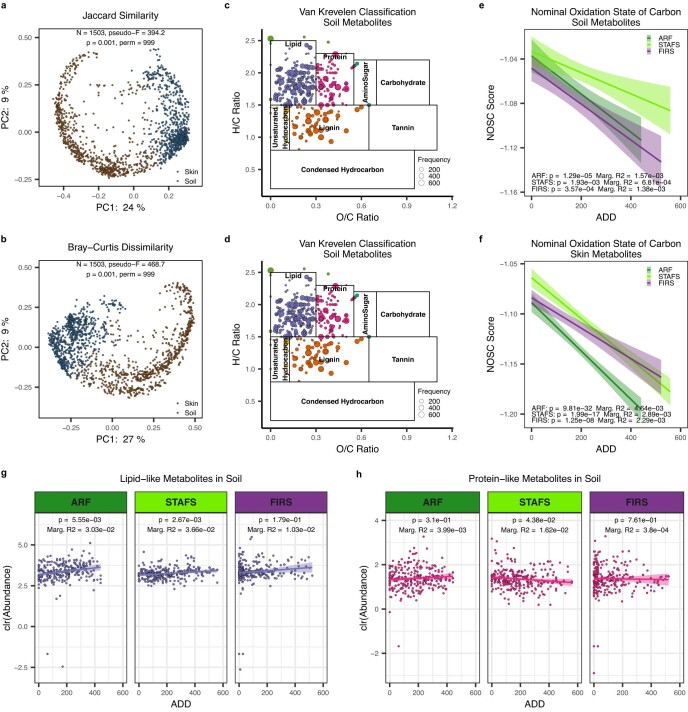
Extended Data Fig. 2. Metabolome Comparison.
Principal coordinate analysis (PCoA) of a) Jaccard and b) Bray-Curtis distances of all unique metabolites and all metabolomic samples show cadaver skin and cadaver-associated soil are significantly different community profiles. n = 1503 biologically independent samples. Significance was determined by PERMANOVA (permutations = 999). Van Krevelen diagram showed a strong presence of lipid-like, protein-like, and lignin-like classes within c) cadaver-associated soils and d) cadaver skin. Metabolites that matched database chemical formulas or had a significantly predicted chemical formula were assigned a Van Krevelen organic compound classification by their hydrogen:carbon and oxygen:carbon molar ratios. Colors correspond to organic compound classification. Nominal oxidation state of carbon (NOSC) scores for cadaver-associated e) soil and f) cadaver skin metabolites with assigned chemical formulas show significant decrease of thermodynamic favorability at all geographical locations over decomposition time measured by accumulated degree days (ADD). Soil: ARF n = 251, STAFS n = 250, and FIRS n = 245 biologically independent samples. Skin: ARF n = 250, STAFS n = 249, and FIRS n = 249 biologically independent samples. Data are presented as mean values +/− 95% CI. Significance measured with linear mixed-effects models within each location and adding a random intercept for cadavers with two-tailed ANOVA and no multiple comparison adjustments. g) Lipid-like metabolites show an increased abundance in cadaver-associated soils over decomposition measured by accumulated degree days (ADD) and significantly increase in temperate soils. h) Protein-like metabolites are less abundant than lipid-like metabolites in cadaver-associated soils over decomposition measured by accumulated degree days (ADD) and significantly decrease in STAFS soil. ARF n = 251, STAFS n = 250, and FIRS n = 245 biologically independent samples. Data are presented as mean values +/− 95% CI. Significance measured with linear mixed-effects models within each location and adding a random intercept for cadavers with two-tailed ANOVA and no multiple comparison adjustments. Metabolite abundance normalized by center log ratio transformation.

