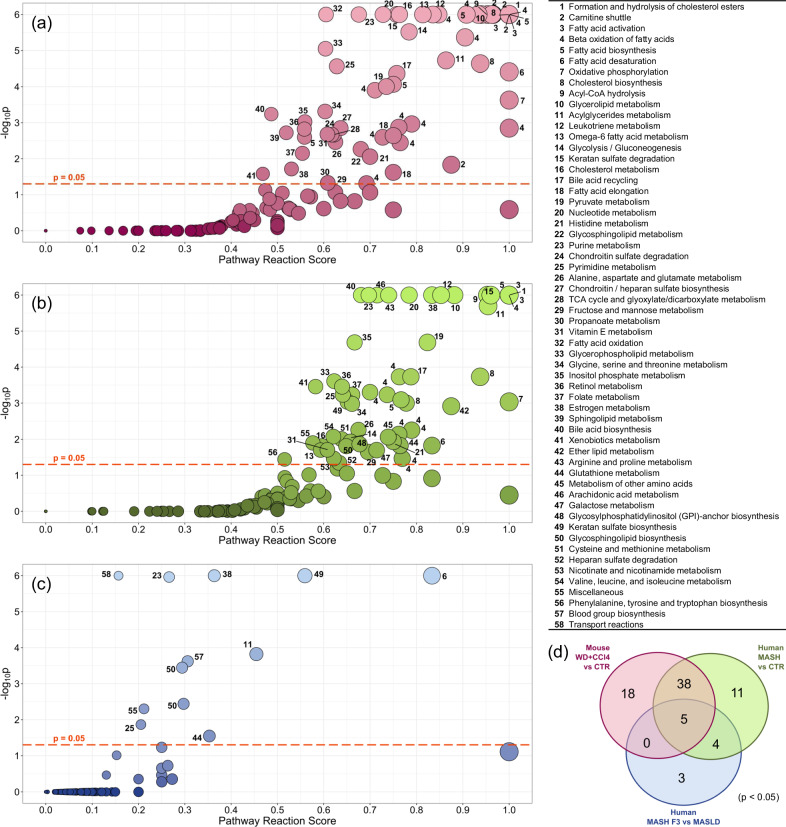
Fig. 2. TDMPA results for the compared cases.
a WD+CCl4 mouse model vs. Control, b human MASH vs. Control, c human MASH F3 vs. MASLD (MASH progression). d Corresponding Venn diagram of the statistically significant (FDR < 0.05) altered pathways across the three datasets. Number labels on the left panels (a, b, c) correspond to the pathways as indicated in the table on the right. WD+CCl4: Western diet supplemented by carbon tetrachloride, MASLD: Metabolic dysfunction-associated steatotic liver, MASH: Metabolic dysfunction-associated steatohepatitis.

