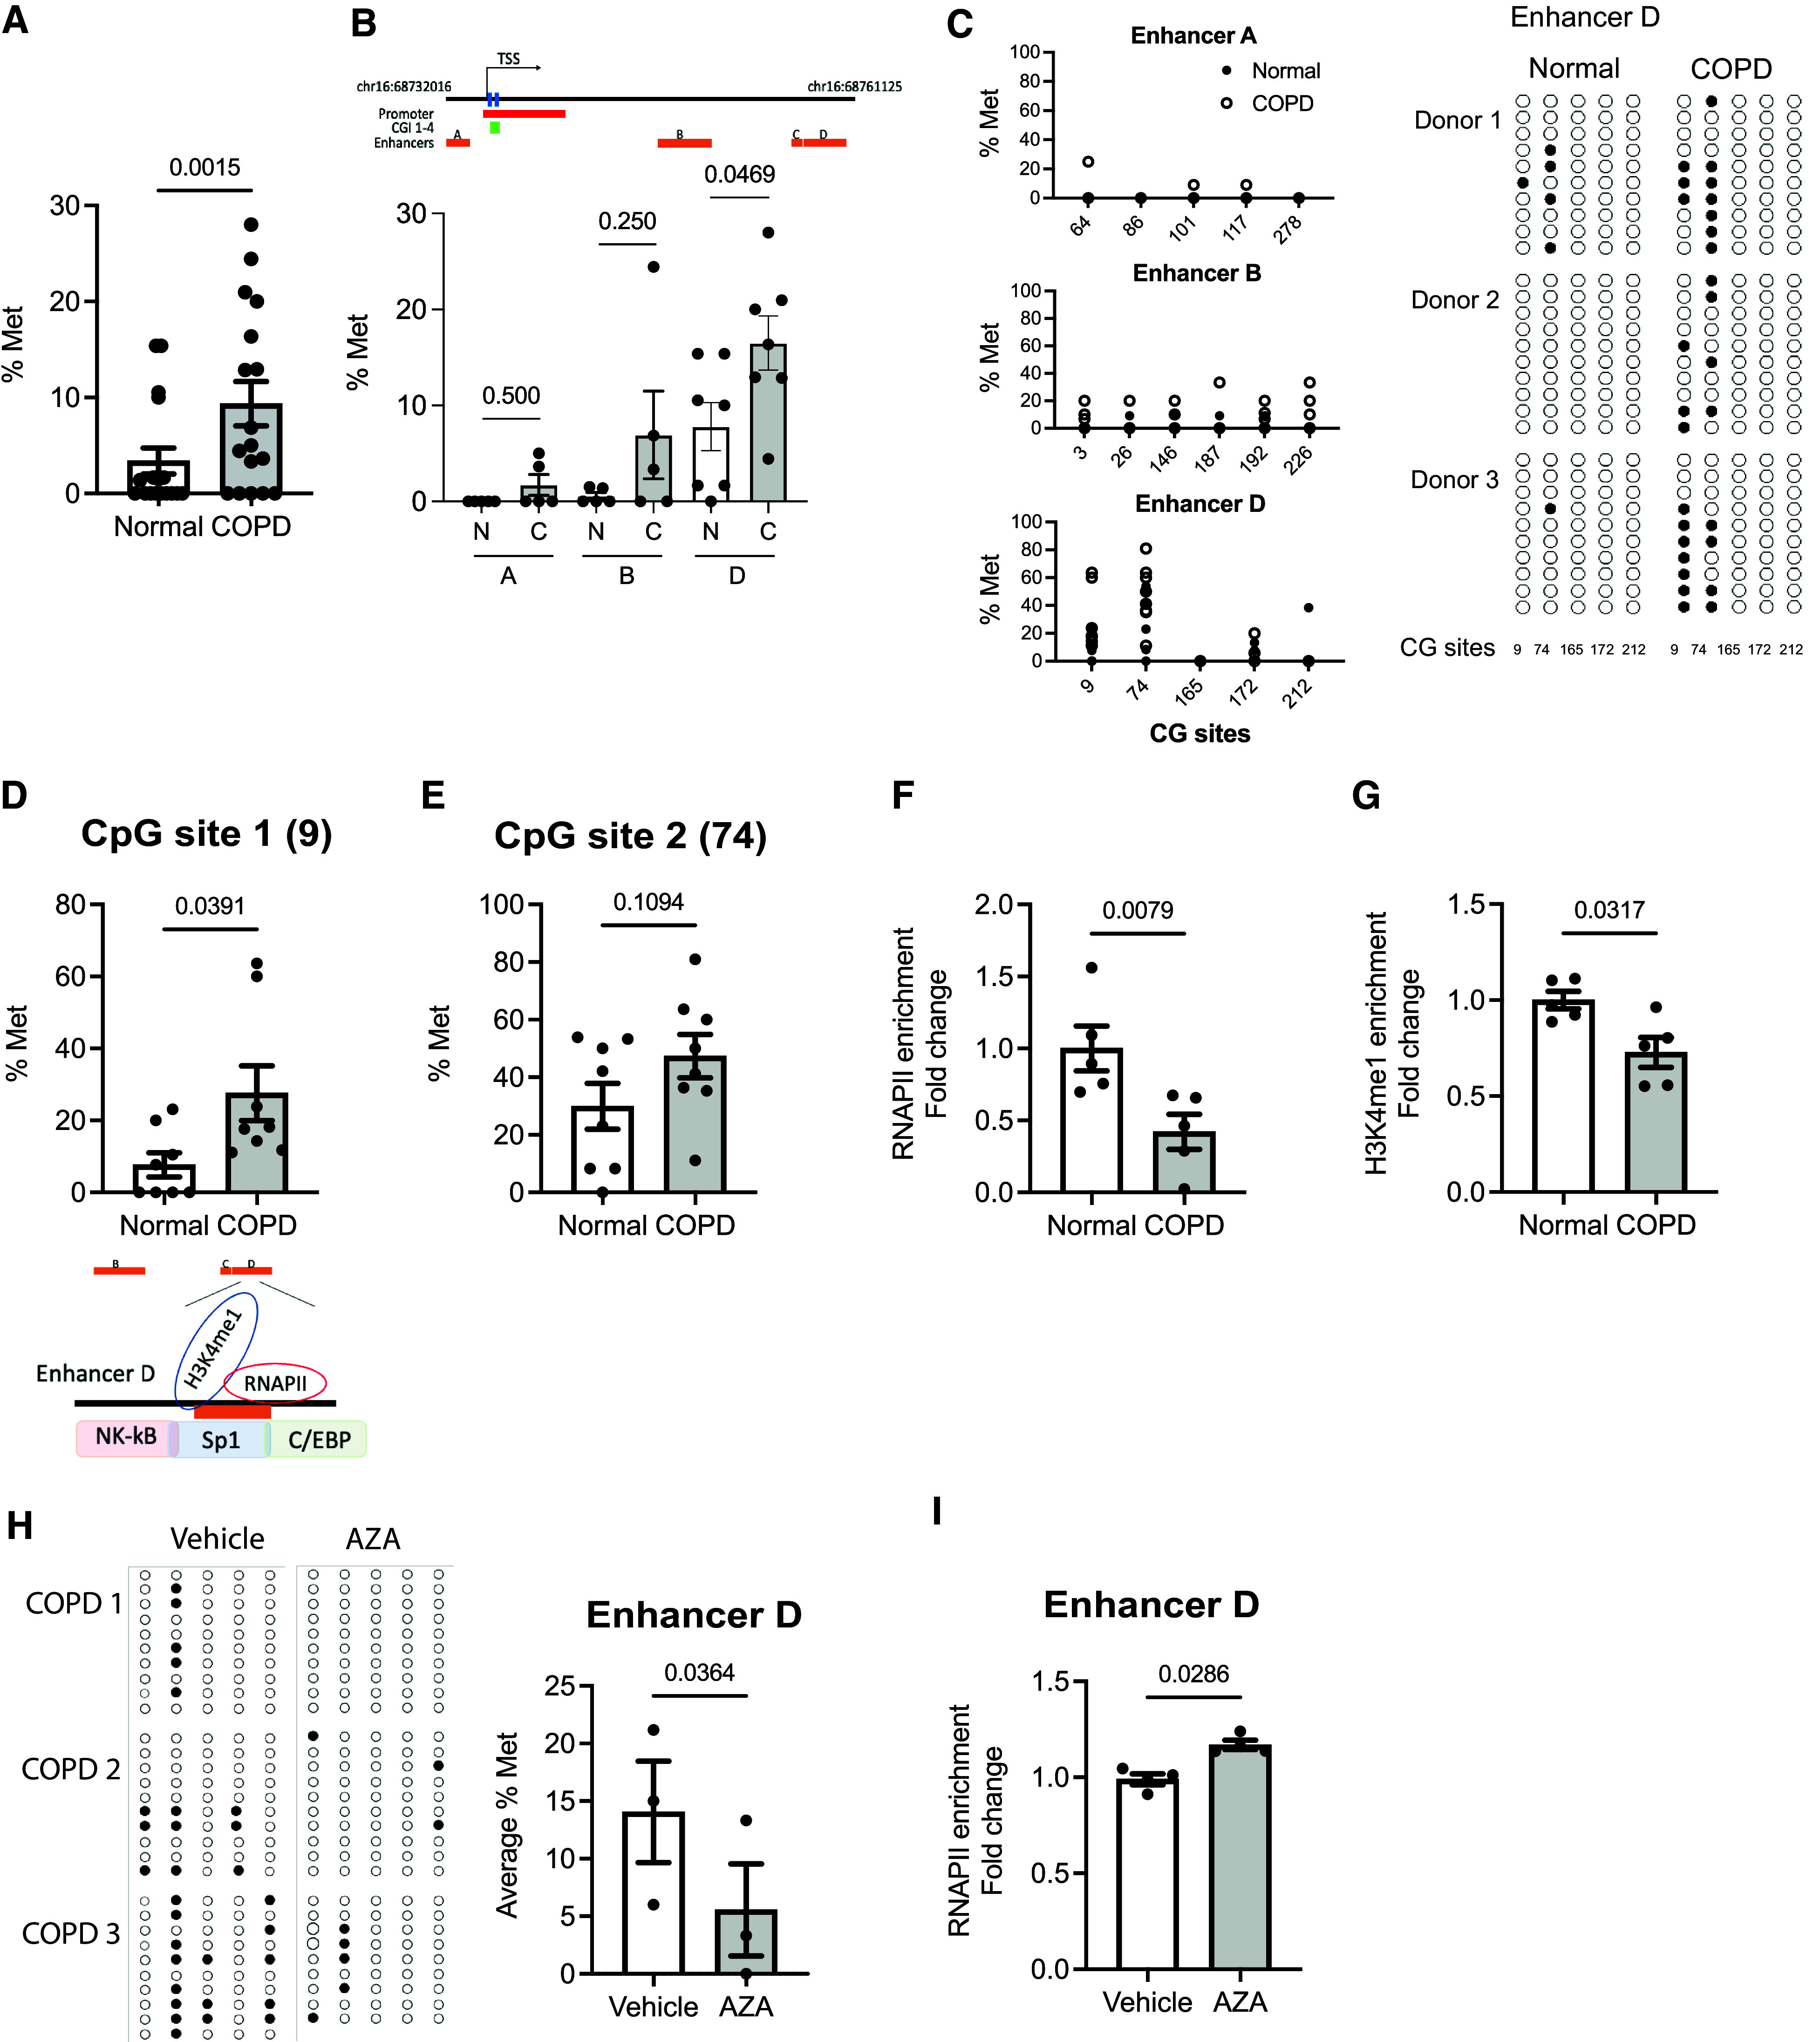
Figure 5.

DNA hypermethylation in the CDH1 enhancer D region blocks RNAPII binding. (A) The average % Met of the CDH1 enhancers A, B, and D was calculated by taking an average of the methylation level of all CpG sites within enhancers A, B, and D of each donor (N: 5–6 normal donors; C: 5–6 donors with COPD) by bisulfite sequencing. (B) The average % Met of CDH1 enhancers A, B, and D. (C) % Met of each CG site of enhancers A, B, and C are shown in graphs (left) and in dot plots (right) (3 normal donors and 3 with COPD). Unmethylated (open circles) and methylated (closed circles) nucleotides are indicated. Each row of circles corresponds to an individual clone sequenced (9–10 clones per donor). (D and E) The % Met (D) Site 1 (CG Site 9) and (E) CpG Site 2 (CG Site 74) of enhancer D in donors with COPD versus normal donors (8 normal and 8 with COPD). (F and G) Enrichment of (F) RNAPII and (G) H3K4 me1 at the enhancer D region (5 normal and 5 with COPD). (H) The methylation at the CDH1 enhancer D in AZA-treated COPD cells is shown in dot plots (left) and in % Met (right) (9–10 clones per group; 3 donors). (I) Enrichment of RNAPII in AZA-treated COPD cells (n = 3). Error bars represent SEM. Statistics were determined by (A, B, D, E, and H) Wilcoxon matched-pairs signed rank tests and (F, G, and I) Mann–Whitney test, with P < 0.05 considered statistically significant.
