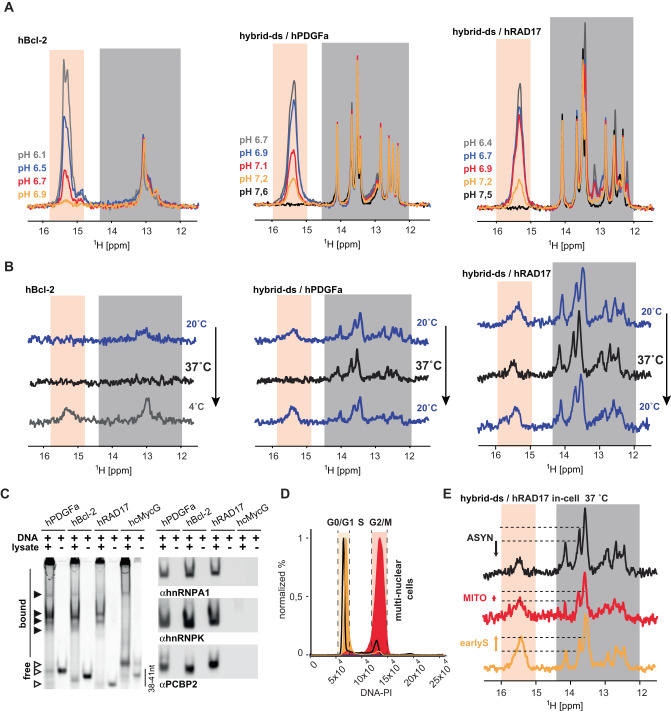
Fig. 2. Hybrid-ds/hRAD17 folds into iM in cells; its iM levels change depending on the cell cycle phase.
A shows overlays of the imino regions of 1D 1H NMR spectra of hBcl-2, hybrid-ds/hPDGFa, and hybrid-ds/hRAD17 acquired at 20 °C as a function of the pH in-vitro (IC buffer: 25 mM KPOi, 10.5 mM NaCl, 110 mM KCl, 1 mM MgCl2, 130 nM CaCl2). Spectral regions specific for the imino protons involved in C:CH+ (iM) and Watson-Crick (ds) base pairs are indicated in light orange and gray, respectively. Note: the Watson-Crick part of the NMR spectra of hybrid-ds/RAD17 display some extra signals compared to the other hybrid-ds/iM constructs. The extra signals come from GC base pairs in the hRAD17 iM segment. B shows imino regions of 1D 1H in-cell NMR spectra of hBcl-2, hybrid-ds/hPDGFa, and hybrid-ds/hRAD17 acquired as a function of the temperature (indicated) in asynchronous HeLa cells. C LEFT: native PAGE of the Cy3-labeled hBcl-2, hPDGFa, hRAD17, and G-quadruplex forming control (hcMycG) in the absence and the presence of lysates from HeLa cells visualized via the Cy3-fluorescence. RIGHT: immuno-stained electroblots (PVDF membrane) of the native PAGE with αhnRPNP A1, αhnRNP K, and αPCBP2. The gel and blot are representative images of three independent experiments. Source data are provided as a Source Data file. D shows PI DNA content staining of cells transfected with (FAM-)hybrid-ds/hRAD17: asynchronous (black line) and synchronized in M (red, G2/M) and early-S (green, G0/S1) cell-cycle phase. E shows imino regions of 1D 1H in-cell NMR spectra of hybrid-ds/hRAD17 acquired at 37 °C in HeLa cells: asynchronous (black) and synchronized in M (red, MITO) and early-S (green, earlyS) cell-cycle phase. The dashed-horizontal lines highlight iM level differences among early-S phase, M-phase, and asynchronous cells. The displayed in-cell NMR spectra are representative images of two independent experiments.

