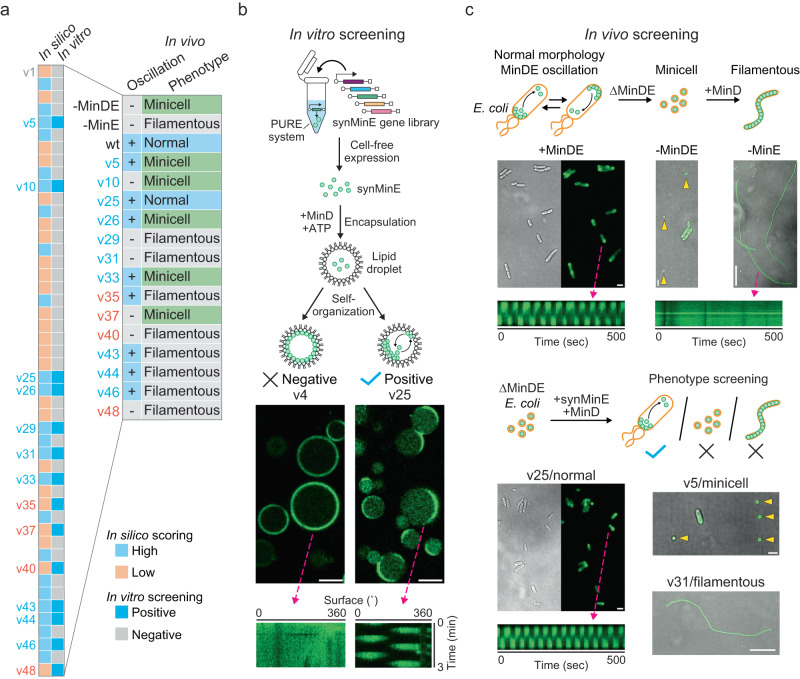
Fig. 3. In vitro and in vivo screening for emergent functions of synMinE variants.
a Summary of the i3-screening results for functional synMinE variants. The colors of each variant name indicate whether they are scored high (blue) or low (orange) by in silico screening. b In vitro screening of synMinE variants. Proteins were synthesized in the PURE cell-free expression system from a gene library of synMinE variants and then encapsulated in lipid droplets with EGFP-MinD (shown in green) and ATP. Emerging Min oscillation patterns as visualized in the kymograph on the bottom-right panel were observed with 14 variants from 48 candidates and further tested in vivo. Scale bars: 20 µm. c In vivo screening of synMinE variants. The remaining 14 variants were introduced in ∆minDE E. coli cells with GFP-tagged MinD. Subsequently, cell morphology and Min oscillation were validated to identify the functional synMinE variants. synMinEv25 fully substituted the wild type (+MinDE condition). Differential interference contrast and fluorescence images are separately indicated for wild type (+MinDE) and synMinEv25 (v25), or merged for the other conditions shown in the figure. Kymographs show Min oscillations inside the cells with wild type or synMinEv25, while MinD did not induce oscillations without MinE (-MinE). Yellow arrows indicate the minicells in -MinDE and v5 conditions. Scale bars: 2 µm (+MinDE, −MinDE, v25, and v5) or 20 µm (−MinE and v31). All the micrographs correspond to a reproducible result from 3 or more independent biological replicates.

