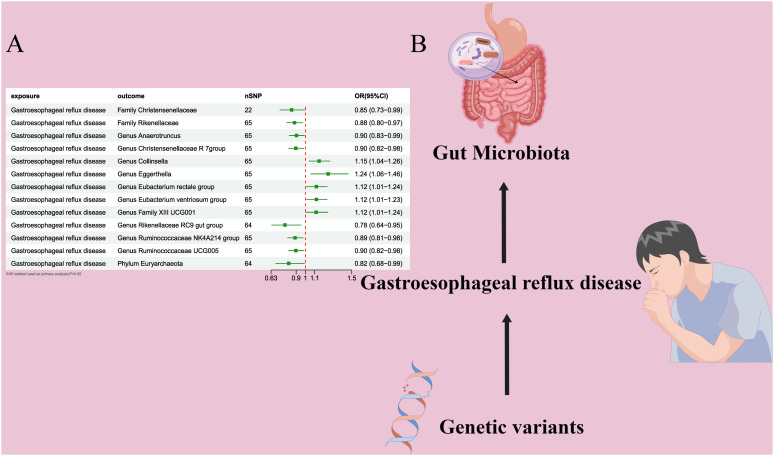
Figure 3.
(A) Forest plot of the MR analysis results. (B) Forest plot of the MR analysis results Causal effect of GERD with gut microbiota Schematic representation of the Reverse MR analysis results. OR odds ratio, CI confidence interval, IVW inverse variance weighted method, Significant threshold was set at P-value <0.05 for the Inverse Variance Weighted method (IVW).

