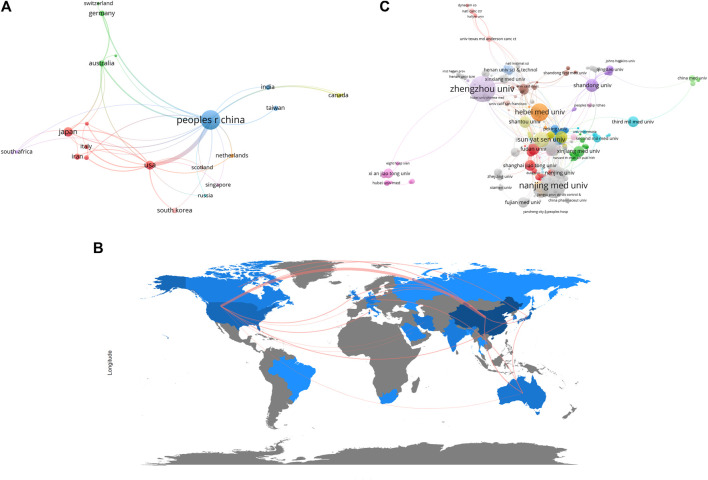
FIGURE 3.
The co-authorship analysis of ncRNAs associated with ESCC. (A) Network plot of co-authorship analysis of countries/regions. (B) World map of co-authorship analysis of countries/regions. (C) Network plot of co-authorship analysis of organizations. The size of the circles or the depth of map color blocks represents the number of publications, and the thickness of the lines between the circles or the map color blocks represents the degree of collaboration.

