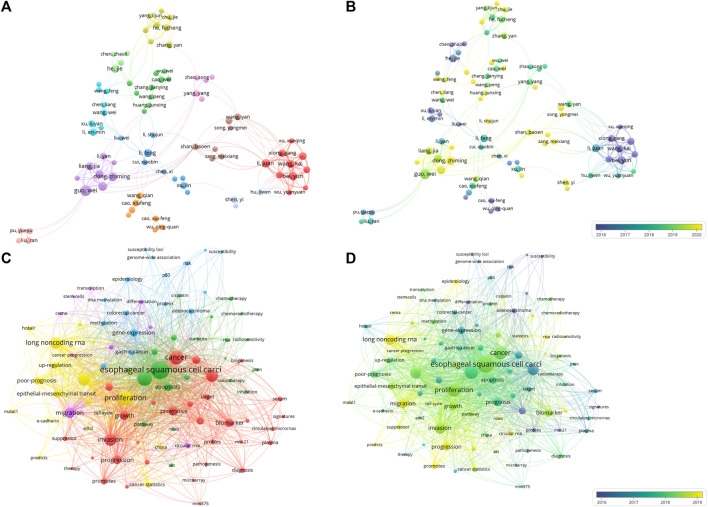
FIGURE 4.
The co-authorship analysis and co-occurrence analysis of ncRNAs associated with ESCC. (A) Network plot of co-authorship analysis of authors. (B) Overlay map of co-authorship analysis of authors. (C) Network plot of co-occurrence analysis of top 100 keywords. (D) Overlay map of co-occurrence analysis of top 100 keywords. In network plot, a circle represents an author or a keyword. The larger the circle, the more articles the author has published or the more frequently the keyword appears. The thickness of the connecting line between circles represents the strength of the association. In overlay map, cold colors indicate that the author was active earlier or the keywords appeared earlier, while warm colors indicate that the author was active more recently or the keywords appeared more recently.

