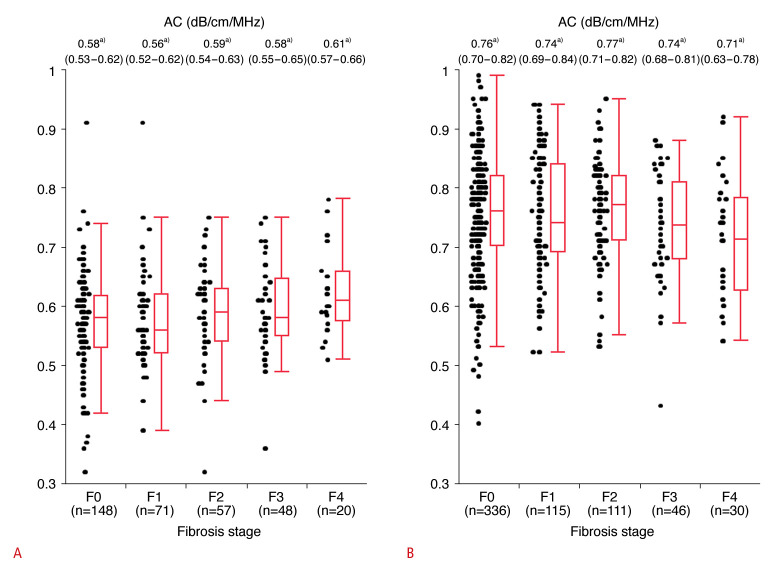
Fig. 2. AC and fibrosis stage according to MR elastography values stratified by the grade of hepatic steatosis based on MRI-derived PDFF.
A. AC by fibrosis grade (F0-F4) in patients without hepatic steatosis (S0, n=344, MRI-derived PDFF <5.2%) is shown. AC was positively correlated with fibrosis stage (P=0.009, Jonckheere-Terpstra test). B. AC by fibrosis grade (F0-F4) in patients with hepatic steatosis (S1-S3, n=638, MRI-derived PDFF ≥5.2%) is shown. AC was not correlated with fibrosis stage (P=0.088, Jonckheere-Terpstra test). a)Median (IQR) AC by fibrosis stage. Fibrosis grade: F0, MR elastography value <2.5 kPa; F1, 2.5 kPa≤MR elastography value<3.4 kPa; F2, 3.4 kPa≤MR elastography value<4.8 kPa; F3, 4.8 kPa≤MR elastography value<6.7 kPa; and F4, MR elastography value ≥6.7 kPa [23]. Steatosis grade: S0, MRI-derived PDFF <5.2%; S1, 5.2%≤MRI-derived PDFF<11.3%; S2, 11.3%≤MRI-derived PDFF<17.1%; and S3, MRI-derived PDFF ≥17.1% [23]. AC, attenuation coefficient based on the ultrasound-guided attenuation parameter; IQR, interquartile range; MR, magnetic resonance; MRI, magnetic resonance imaging; PDFF, proton density fat fraction.

