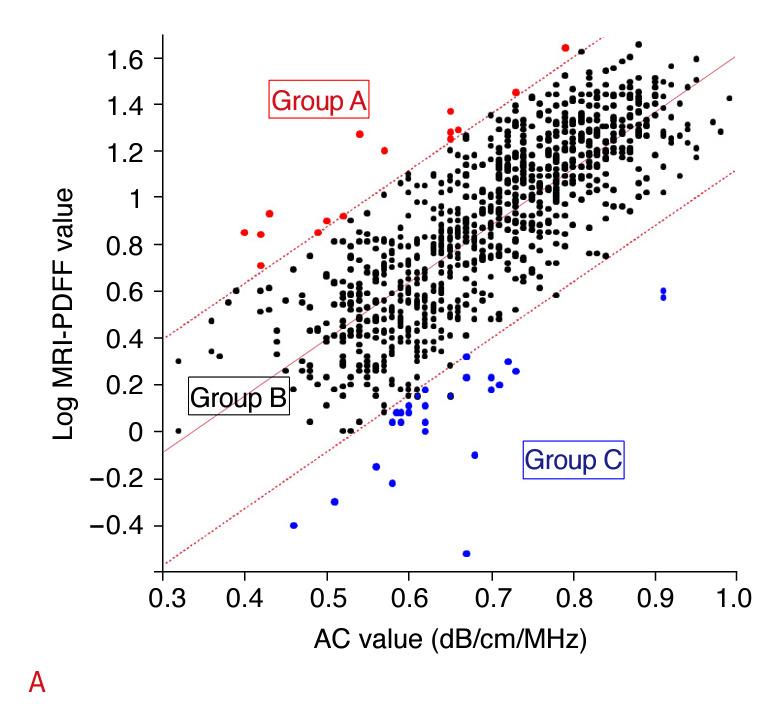
Fig. 3. Correlations between AC and log MRI-derived PDFF values.

The correlation between AC and log MRI-derived PDFF values fell outside the 95% confidence interval for the slope of the regression line in 52 of 982 patients (5%). All patients were classified into the following three groups: group A (n=16), high MRI-derived PDFF and low AC; group B (n=930), concordant MRI-derived PDFF and AC; group C (n=36), low MRI-derived PDFF and high AC. AC, attenuation coefficient based on the ultrasound-guided attenuation parameter; MRI, magnetic resonance imaging; PDFF, proton density fat fraction.
