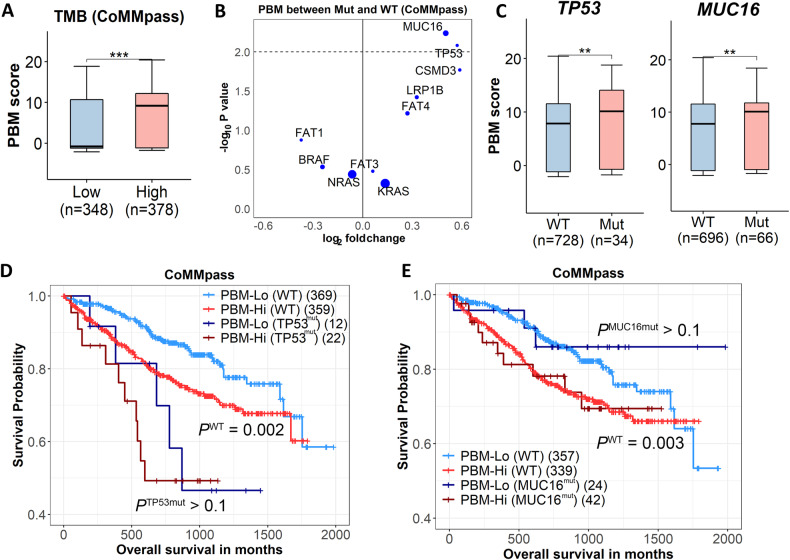
Fig. 4. PBM score and MM driver mutations.
A Patients with higher tumor mutation burden (TMB) have higher PBM scores than those with lower TMB. TMB cutoff: median. Wilcoxon’s rank-sum test. B The PBM scores of patients with a given nonsynonymous gene mutation in ten genes compare to the PBM scores of patients with wild-type of the gene. The size of each point indicates the sample size of the mutated gene. p value is generated using Wilcoxon’s rank sum test. C The PBM scores of patients with TP53 or MUC16 mutations compared to that of patients carrying wild-type. D KM-plot of OS for patients with high PBM scores versus those with low PBM scores stratified by TP53 mutation status using the CoMMpass dataset. p values are calculated by Cox regression, and the cutoff of high and low PBM groups is the median PBM score of all patients. E KM-plot of OS for patients with high PBM scores versus those with low PBM scores stratified by MUC16 mutation status using the CoMMpass dataset.

