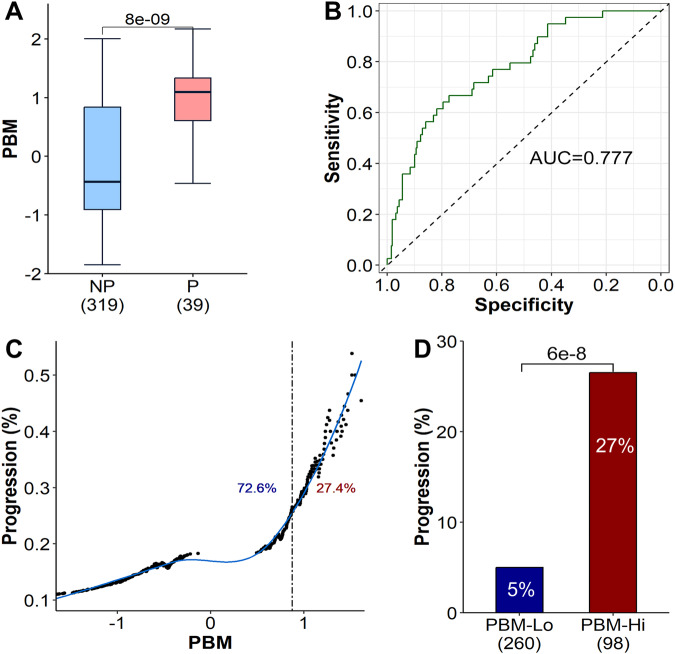
Fig. 7. PBM scores as predictors of the progression from MGUS to MM.
A Comparison of PBM scores between MGUS patients who progressed to MM (P) and those who did not progressed (NP) to MM. PBM scores are significantly higher in the “P” group compared to the “NP” group. p values were calculated using the Wilcoxon rank-sum test. B Receiver operating characteristic (ROC) curve for predicting progression to MM using PBM scores. C Proportion of MGUS patients with progression exceeding the critical PBM threshold, determined individually for each patient. The dashed line represents the optimal PBM cutoff of 0.875 as derived from the ROC curve, with percentages indicating the rate of patients categorized into low and high PBM groups based on this cutoff. D Proportions of MGUS patients who progressed to MM in high and low PBM groups. p values are calculated using Fisher’s exact test.

