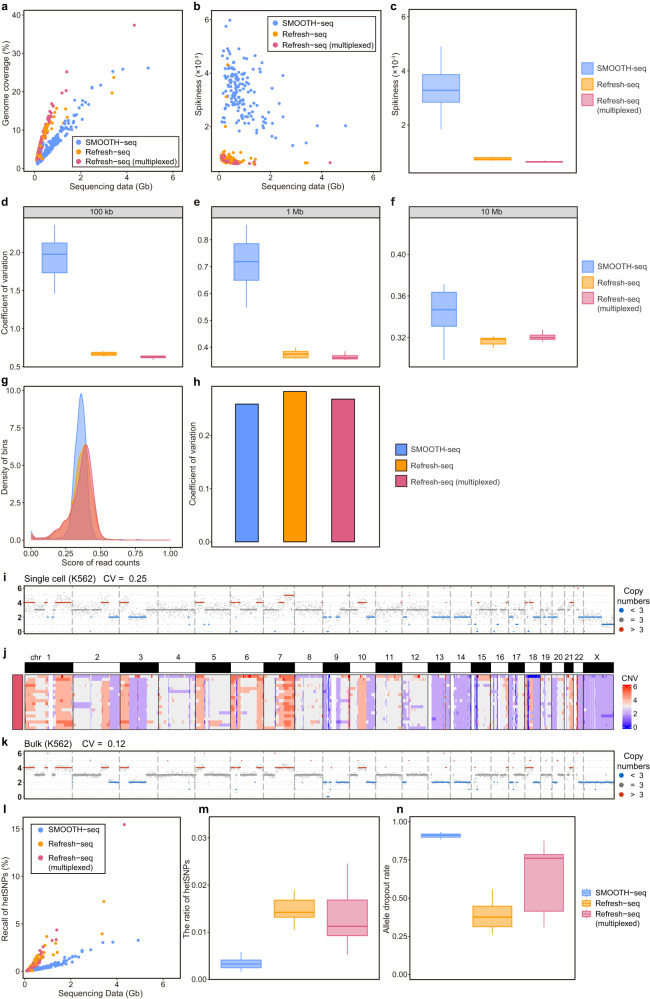
Fig. 2. Comparison of Refresh-seq with SMOOTH-seq.
a Scatter plot showing the sequencing data and genome coverage of each HG002 cell. Cells amplified with SMOOTH-seq were shown as blue dots. Cells amplified with Refresh-seq (single tube version) were shown as orange dots. Cells amplified with Refresh-seq (multiplexed) were shown as red dots. b Scatter plot showing the sequencing data and Spikiness value of each HG002 cell. c Boxplot showing the quantification of Spikiness values at ~0.25× sequencing depth shown in b. For boxplots, center line represents the median; box limits represent upper and lower quartiles. d–f CVs for read depths along the genome under 100 kb, 1 Mb and 10 Mb bins, respectively, showing amplification bias on different scales. g The density of bins with normalized read depths in pseudobulk (~13×) from SMOOTH-seq, Refresh-seq and Refresh-seq (multiplexed). h CVs of the read depths in pseudobulk (~13×) from SMOOTH-seq, Refresh-seq and Refresh-seq (multiplexed). i CNVs of one single K562 cell showing in 1 Mb windows. j CNVs for 18 single K562 cells amplified with Refresh-seq showing on heatmap. k CNVs of bulk K562 samples showing in 1 Mb windows. l Scatter plot showing the sequencing data and the detection of both alleles at hetSNP sites of each cell. m Quantification of the ratios of hetSNPs detected by SMOOTH-seq, Refresh-seq and Refresh-seq (multiplexed). n Allele dropout rates of SMOOTH-seq, Refresh-seq and Refresh-seq (multiplexed) at hetSNP sites covered by over 5 reads.

