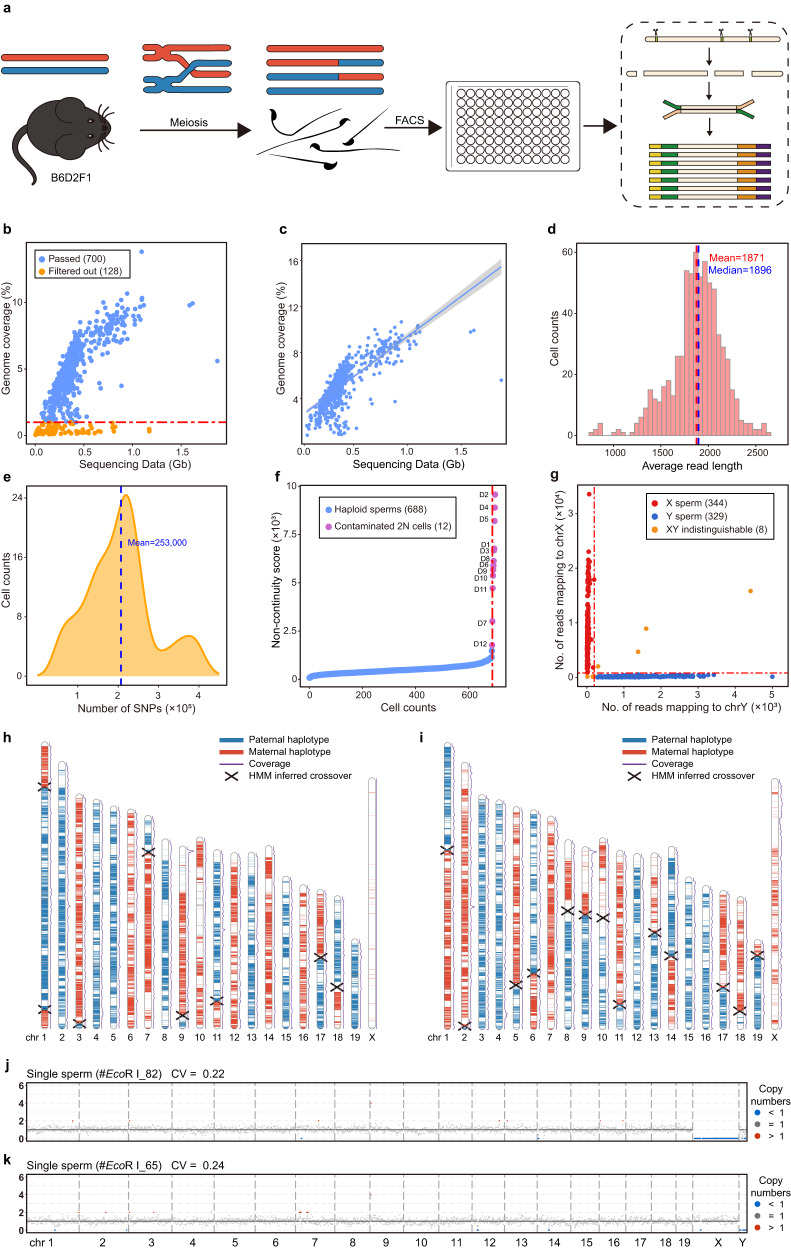
Fig. 3. Schematic charts of mouse sperm meiosis and phasing of genome using single-sperm Refresh-seq data.
a Schematic charts showing the process of meiosis of hybrid mouse sperm and Refresh-seq of single sperm. Mature sperm cells of B6D2F1 (B6 × DBA F1 hybrid) mice undergone meiotic homologous recombination were obtained and sorted to each well by fluorescence-activated cell sorting (FACS). Refresh-seq was performed to each single sperm. b Scatter plot showing the sequencing data and genome coverage of each sperm cell. Cut off was set at genome coverage of 1% marked as red dotted line. c Scatter plot showing the sequencing data and genome coverage of each sperm cell passed quality control fitted with linear regression (line) at 95% credible interval (shading). d Distribution of average read-length for single sperm amplified by Refresh-seq. The mean and median lengths are marked as red and blue dotted lines respectively. e Distribution of the number of hetSNPs covered in each sperm. The mean number of the covered hetSNPs is marked as blue dotted line. f Computational recognition of diploid cells by the non-continuity scores of each sperm (exclude the autosome with the highest frequency). Non-continuity scores of contaminated diploid cells are much higher than haploid sperm. The dashed red line marks the inflection point beyond which sperm cells are flagged as potential diploid cells showing as purple dots and excluded from downstream analysis. g Distinction of X sperm cells and Y sperm cells using number of reads mapping to X and Y chromosomes. 344 X sperm cells (red dots) and 329 Y sperm cells are identified, with 8 sperm cells being indistinguishable for X or Y (orange dots). h, i Parental haplotype contribution map of the 20 chromosomes from individual sperm cells. Parental haplotype contributions are determined by the proportion of the paternal or maternal SNPs, and crossover positions are detected by identifying the crossing locations of the two parental haplotypes by an HMM. Parental haplotype contribution map of the 20 chromosomes from one Y sperm cell is shown in h and map of one X sperm cell is shown in i. Blue regions are contributed by the paternal SNPs and red regions are contributed by the maternal SNPs. Crossover sites are marked as forks. j CNVs of the Y sperm displayed in h, showing in 1 Mb windows. k CNVs of the X sperm displayed in i, showing in 1 Mb windows.

