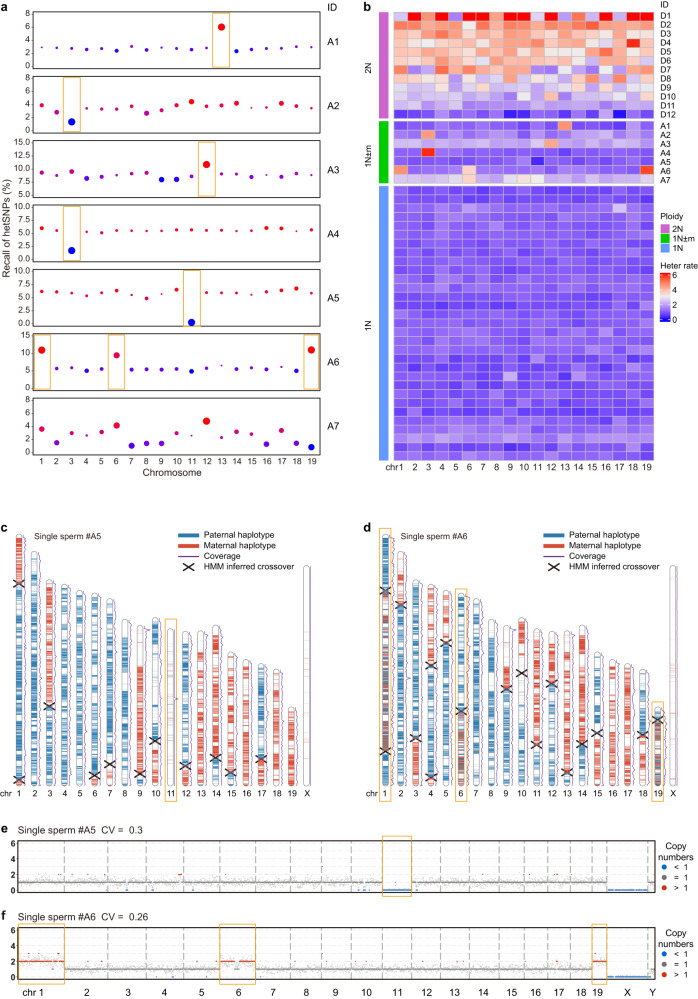
Fig. 4. Identification of aneuploid sperm.
a The ratios of covered hetSNPs compared with the gold standard in 19 autosomes from 7 aneuploid sperm cells. Outlier blue dots indicate loss and red dots indicate gain of chromatids. The sizes of the dots mean the deviation from the average ratio. The verified aneuploid chromosomes are highlighted by orange rectangles and the sperm A7 is more likely to be an unevenly amplified sample (technical artefact) rather than true aneuploidy. b The rates of covering both alleles at hetSNP sites in sperm cells. Heatmap showing the heterozygosity rates of the 19 autosomes from 12 diploid cells (showing as 2 N), 7 aneuploid sperm cells (1 N ± m) and several haploid sperm cells (1 N). The sperm A7 is more likely to be an unevenly amplified sample (technical artefact) rather than true aneuploidy. c Parental haplotype contribution map of the 20 chromosomes from the aneuploid sperm cell A5 with loss of chromosome 11. Blue regions are the paternal SNPs and red regions are the maternal SNPs. Crossover sites are marked as forks. d Parental haplotype contribution map of the 20 chromosomes from the aneuploid sperm cell A6 with gain of chromosomes 1, 6 and 19. Blue regions are the paternal SNPs and red regions are the maternal SNPs. Crossover sites are marked as forks. e CNVs of the aneuploid sperm A5, showing in 1 Mb windows. f CNVs of the aneuploid sperm A6, showing in 1 Mb windows.

