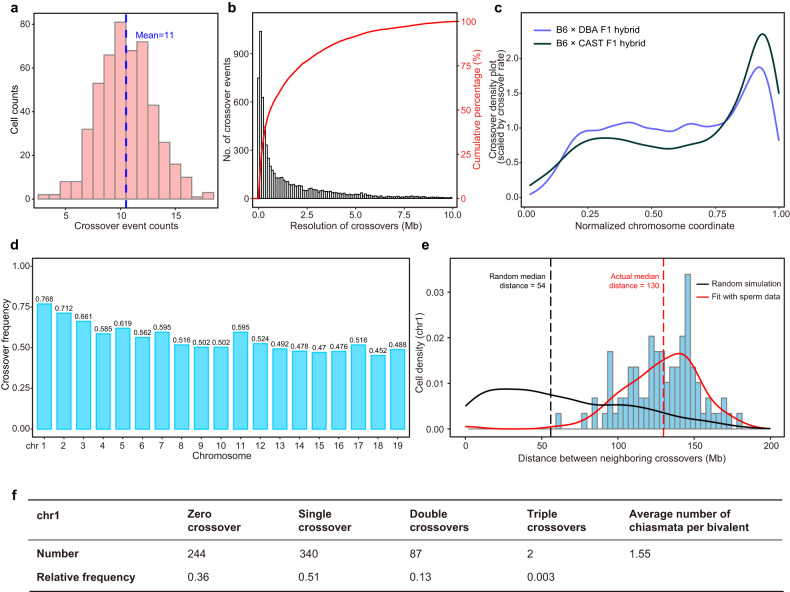
Fig. 5. Distribution characteristics of crossovers in mouse sperm.
a Distribution of the number of autosomal crossover events identified per sperm. The mean number of crossovers is marked as the blue dotted line. b Resolution of crossover determination at sequencing depth of ~0.1–0.3×. Accumulative percentage of crossover numbers is shown as red curve. c Crossover location density plots for all chromosomes. The x axis shows the normalized chromosome coordinate in which ‘0’ means the top of chromosomes and ‘1’ means the bottom of chromosomes. It shows the crossover density by the distances from the centromere to telomere. The blue curve shows the distribution of crossovers in our data of B6 × DBA F1 hybrid sperm and the black curve shows the distribution in data of C57BL/6J × CAST/EiJ F1 hybrid sperm from the previous study31. d Average number of crossovers identified per chromosome per sperm, showing ~0.5 crossovers per haploid sperm (indicating at least one crossover per chromosome pair per meiosis). e Crossover interference on chromosome 1 of male meiosis. Distance between two crossover events on the same chromosome 1 is measured in megabases of DNA length. The red line represents the distribution curve fitting the experimental data. The black line shows the distribution of randomly generated distances. The dotted lines represent the median distance of the random data and experimental data. f Distribution of crossover classes along chromosome 1.

