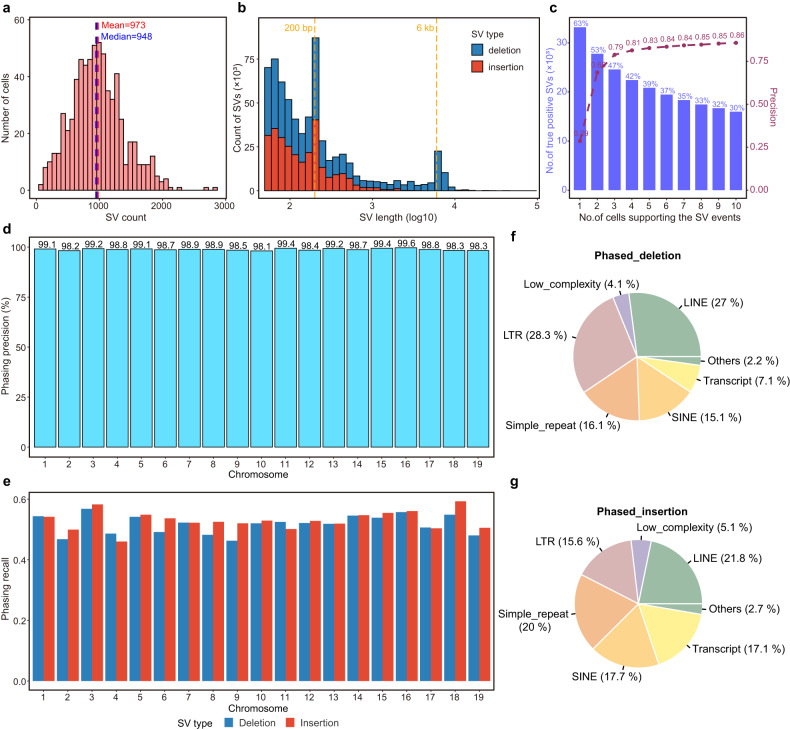
Fig. 6. Detection and phasing of SVs in mouse sperm.
a Distribution of the number of true positive SVs identified per sperm. The mean and median numbers of SVs are marked as red and blue dotted lines respectively. b Length distribution of identified true positive SVs. Deletions are shown in blue and insertions are shown in red. Local peaks of SV length are marked as orange dotted lines. c Precision of SVs (deletions and insertions) detected by Refresh-seq and the percentage of true positive SVs with different numbers of supporting cells. d The genome-wide haplotype phasing precision of SVs on the chromosome scale. e The proportion of phased SVs in bulk benchmark SVs set on the chromosome scale. Deletions are shown in blue and insertions are shown in red. f The proportion of different types of elements involved in phased deletions. g The proportion of different types of elements involved in phased insertions.

