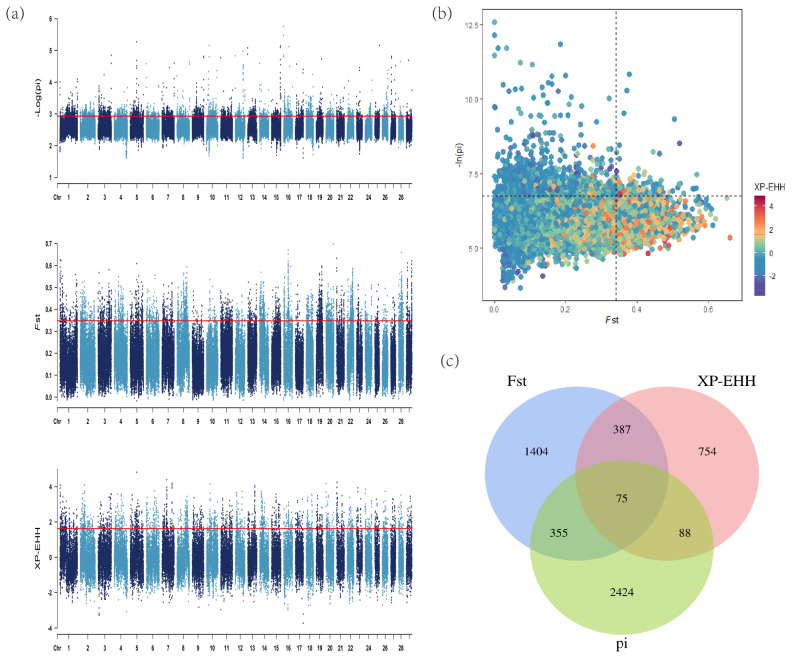
Figure 3.
Analysis of the signatures of positive selection in the genome of Luxi cattle. Red line displays the threshold levels of 5%. (a) Manhattan plot of selective sweeps in Luxi cattle. Alternating colors distinguish markers on neighboring chromosomes. (b) Conjoint analysis of the signatures of pi, Fst, and XP-EHH of Luxi cattle. (c) Venn diagram showing the genes overlap among pi, Fst, and XP-EHH significant selection region.

